FIGURE 2.
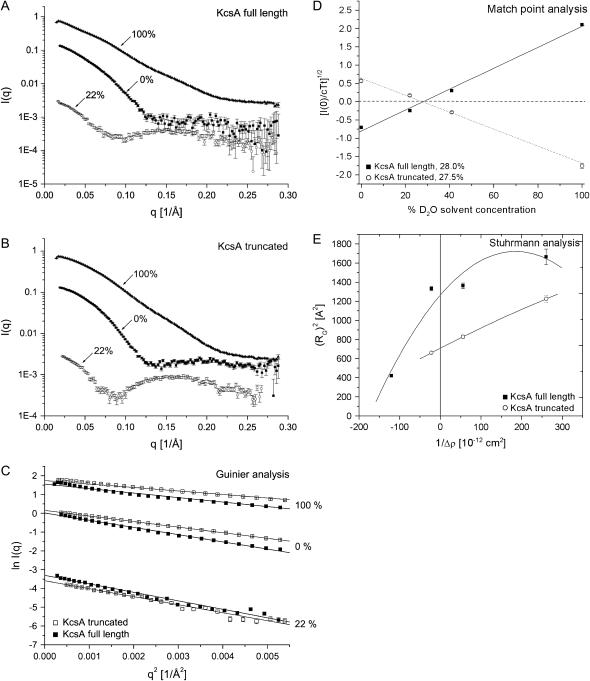
SANS data of full-length and truncated KcsA at pH 7.5. SANS data were collected over a q-range from 0.0024 to 0.28 Å−1. (A and B) Intensity data of full-length and truncated KcsA at 0%, 22%, and 100% D2O solvent concentration. (C) Guinier analysis of full-length and truncated KcsA at 0% (RG, 36.1 ± 0.4/29.7 ± 0.3 Å), 22% (RG, 38.8 ± 0.3/32.6 ± 0.9 Å) and 100% (RG, 35.7 ± 0.3/28.2 ± 0.3 Å) D2O solvent concentration. (D) Square root of the normalized zero-angle scattering intensity of full-length and truncated KcsA at 0%, 22%, 41%, and 100% D2O solvent concentration. This analysis yields the match point for the protein-detergent complex. (E) Stuhrmann analysis of both KcsA species at pH 7.5. The reciprocal of the contrast is plotted against the square of the radius of gyration (RG) with α = 4.9 and 2.1 × 10⁻¹² and β for full-length KcsA is 1.3 × 10⁻²⁶. Data derived at 41% D2O solvent concentration were collected as part of the low-pH analysis of full-length KcsA described hereafter (Table 2) and included for statistical reasons.

