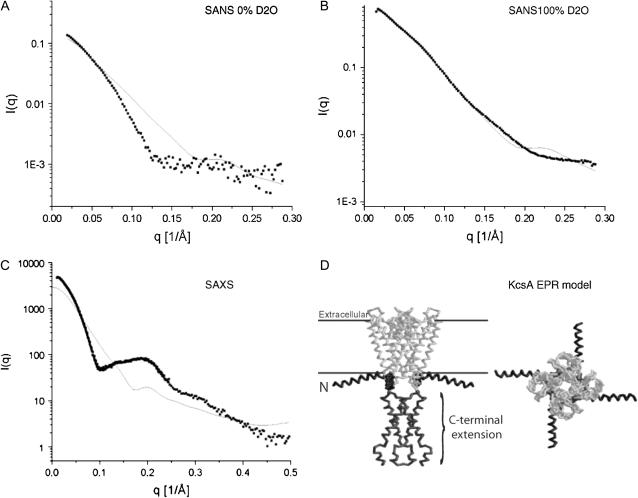
FIGURE 9.
Comparison of experimental and theoretical scattering data at pH 7.5. The theoretical scattering intensities of the full-length KcsA EPR model (solid line) are compared to the experimental intensities at 0% (A) and 100% (B) D2O solvent concentration and to the x-ray derived scattering data (C). Single density spheres were used to model the experimental curves.(D) Side and top views of the KcsA EPR model (pdb code 1F6G), with N- and C-terminal domains indicated.

