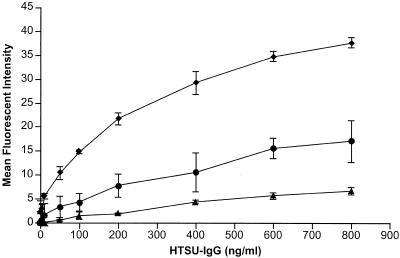
FIG. 5.
Cell lines with different susceptibilities to MLV(HTLV-1) transduction show different levels of binding at saturation. Cell lines with different levels of susceptibility to MLV(HTLV-1) transduction (293, NIH 3T3, and MDBK) were fixed in 4% paraformaldehyde for 30 min on ice, washed, and incubated with various concentrations of HTSU-IgG or SUA-IgG on ice, and binding assays performed with the mean fluorescent intensities calculated as described in Materials and Methods. Immunoadhesin and secondary antibody incubations were carried out under conditions shown not to be kinetically limited (see Materials and Methods). These titers represent the means for two independent experiments; error bars show the SEM. ♦, 293 cells; •, NIH 3T3 cells; ▴, MDBK cells.

