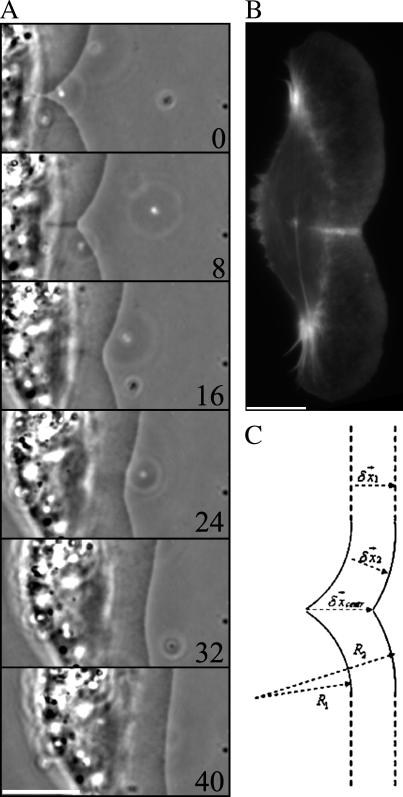
FIGURE 4.
Recovery of the leading edge shape. (A) After the readhesion, protrusion of the formerly arrested part of the leading edge results in the recovery of the initial shape. (B) TRITC-phalloidin staining of the keratocyte fixed at the moment of recovery shows F-actin accumulation at the site of the indentation. (C) Normal extension from both sides of the indentation explains the recovery of the leading edge shape in agreement with the GRE model. Bar, 10 μm; time in seconds.

