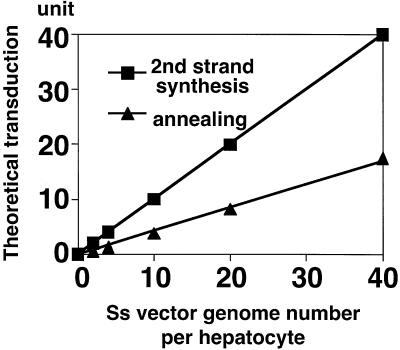
FIG. 3.
Theoretical dose-response curves in a second-strand synthesis model and an annealing model, in such a situation that all incoming ss genomes are utilized for stable transduction in a most efficient manner. Representative values (n = 0, 2, 4, 10, 20, and 40; n represents the number of parental ss vector genomes in a hepatocyte) are plotted. A transduction unit is defined as an amount of transgene product in a cell which can be produced from one ds rAAV genome. The regression curve for the annealing model in this graph is f2(n) = −0.049 + 0.413n (r = 0.999), and therefore f2(n) is increased in proportion to n.

