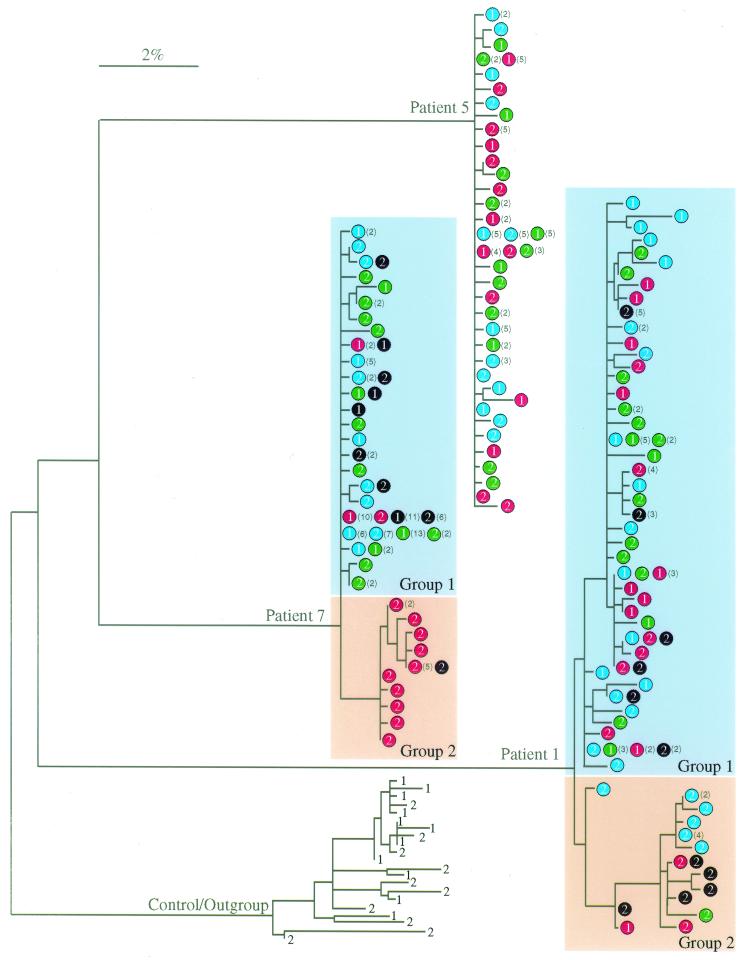
FIG. 4.
Phylogenetic tree analysis of HIV-1 envelope sequences in CD14+ monocytes (red circles), activated (blue circles) and resting CD4+ T cells (green circles), and plasma (black circles) of patients receiving HAART. The number within each circle is the sample number (i.e., 1 and 2 indicate samples I and II). Numbers in parentheses are the numbers of sequences that were identical in the sample to the left. The outgroup is a patient (46) who was not on therapy but whose samples were obtained over a time frame similar to that of the ingroup. Numbers on these sequences are relative sampling times. The bar indicates genetic distance.

