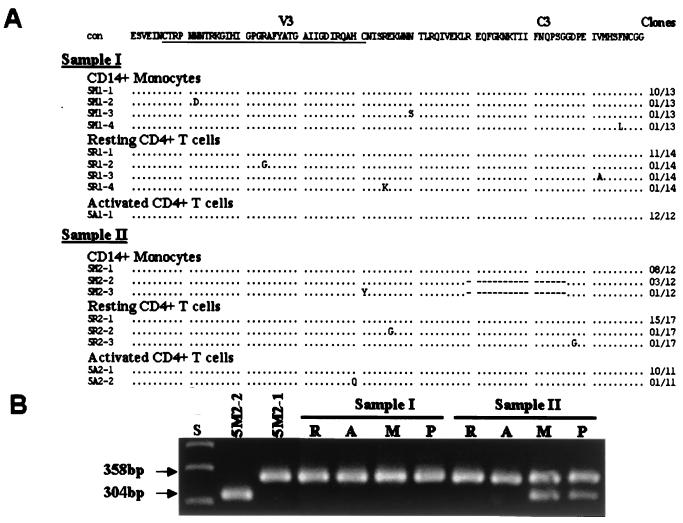
FIG. 5.
Comparison of HIV-1 V3-C3 env gp120 sequences in CD14+ monocytes, activated and resting CD4+ T cells, and blood plasma from patient 5. (A) Alignment of deduced amino acid sequences in CD14+ monocytes and activated and resting CD4+ T cells. The consensus sequence (con) is at the top, with the V3 loop underlined. Dots indicate amino acids identical to the consensus sequence; dashes indicate sequence deletions. The numbers of clones with identical sequences are shown on the right. (B) PCR analysis of HIV-1 V3-C3 sequences in CD14+ monocytes (M), activated (A) and resting (R) CD4+ T cells, and blood plasma (P). 5 M2-2 is a minor variant population with the 54-bp deletion; 5 M2-1 is the major population of sequences present in all cell populations and plasma samples. S, size markers.

