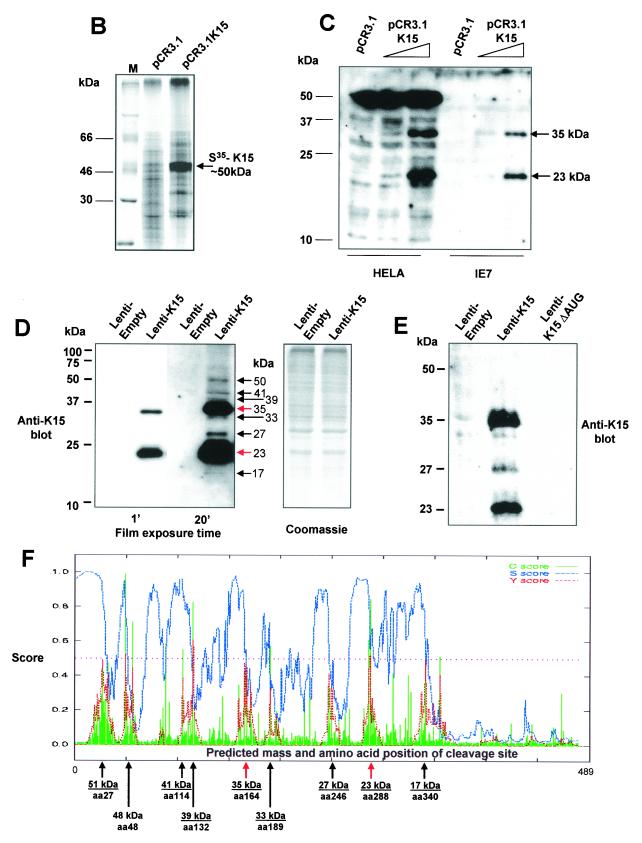
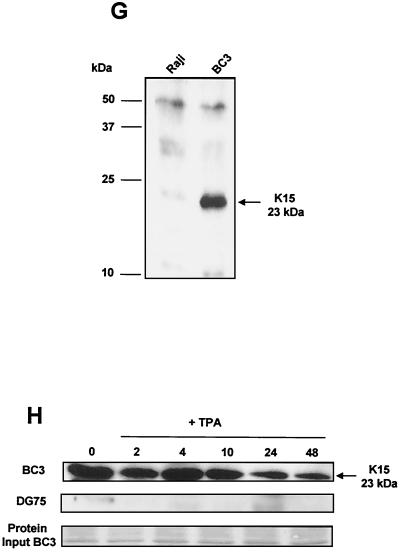
FIG. 1.
K15 expression analysis. (A) Sequence comparison of K15 C-terminal domain for the P and M forms. The predicted C-terminal cytoplasm domains of both the P and M forms of K15 are shown. Grey shading indicates identical amino acids. Dashed lines indicate amino acids deleted for mutational analysis (see below). Predicted SH2-B and SH3-B domains are indicated. The boxed region indicates putative mitochondrial targeting sequence. (B) In vitro TNT in the presence of [35S]methionine and pCR3.1 (vector only) or pCR3.1K15 as indicated. The full-length eight-exon form of K15 produces a protein of approximately 50 kDa. (C) HeLa and the endothelial cell line IE7 as indicated were transiently transfected with either vector-only control (pCR3.1) or full-length wild-type K15 (pCR3.1K15). The predominant protein sizes for K15 in all three cell types were 23 and 35 kDa. (D) Primary HMVEC were infected with lentivirus expressing K15 (Lenti-K15) and virus not expressing K15 (Lenti-empty [negative control]). Equal viral loads were determined by p24 ELISA (data not shown). Cell extracts were made 48 h postinfection and Western blotted with anti-K15 MAb (3B5/D7), developed using ECL, and exposed to autoradiographic film for the indicated times. The blot was subsequently stained with Coomassie blue to demonstrate equal protein input. (E) Infection of HMVEC with Lenti-empty, Lenti-K15, and Lenti-K15ΔAUG. At 48 h postinfection cell extracts were Western blotted with anti-K15 MAb. (F) Internal signal sequence cleavage site prediction for K15. For the prediction of cleavage sites within K15 we employed the SignalP V1.1 prediction program (see Materials and Methods). The arrows indicate amino acid positions of predicted cleavage sites and the molecular mass of the cleaved C-terminal protein product. Red arrows indicate those sites that most closely match the cleavage consensus sequence. (G) Endogenous expression of K15. Raji and BC3 (PEL) cell extracts equivalent to 105 cells were also subjected to SDS-15% PAGE and blotted for K15 with the 3B5/D7 MAb as described above. Positions of molecular mass markers are indicated at left. The predominant protein detected was 23 kDa. (H) K15 protein kinetics of expression following lytic cycle induction. BC3 and DG75 cells (6.0 × 10⁵) were treated with TPA (20 ng/ml). At the time points indicated 105 cells were harvested and lysed and subjected to SDS-PAGE and anti-K15 blotting as described above.


