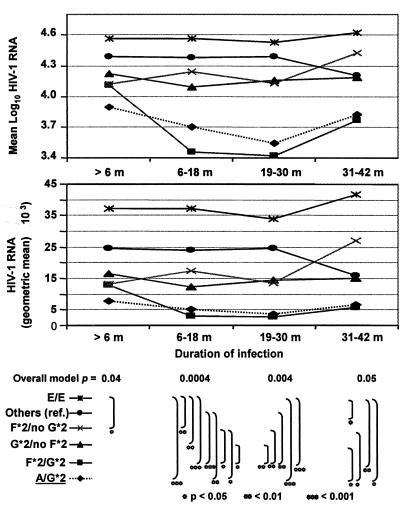
FIG. 1.
HIV-1 RNA concentrations (mean log10 and geometric mean) during initial 42 months following seroconversion. RNA levels are plotted at each of four successive intervals (>6, 6 to 18, 19 to 30, and 31 to 42 months) after seroconversion according to CCR2-CCR5 genotypes. At each point, a GLM test of the aggregate contribution of four major genotypes showed a statistically significant overall relationship (F test). Substantial differences were also seen in pairwise comparisons (t tests at three levels: *, ≤0.05; **, ≤0.01; and ***, ≤ 0.001). Mean viral RNA for carriers of A/G*2 (dotted line) is shown separately and as part of the G*2/no F*2 group.

