Abstract
We analyzed the evolution of the human immunodeficiency virus type 1 (HIV-1) env gene in 12 chronically infected individuals who underwent structured treatment interruptions (STIs). Analyses of length variation and of clonal sequences demonstrated highly unpredictable evolution, which may limit the strengthening of HIV-specific immune responses by STIs because of the variability in exposure to viral antigens.
To determine whether temporary exposure to a patient's autologous human immunodeficiency virus type 1 (HIV-1) antigens may promote HIV-specific immune control of viral replication, the potential benefits of structured treatment interruptions (STIs) are being evaluated (7, 14, 16, 17). A rapid rebound of the virus usually occurs following treatment interruption in chronically infected patients (7, 8, 13, 17, 18). This is in contrast to findings from studies of STIs in acutely infected patients, some of whom exhibit sustained control of viral replication. This difference in outcomes may reflect the relatively modest cytotoxic T-lymphocyte and T-helper-cell responses in cases of chronic infection compared to those in cases of acute infection (16, 20).
In chronically infected patients with suppressed viral loads during highly active antiretroviral therapy, the source of the rebounding virus is not clear. One study involving a single interruption showed that the rebounding plasma virus was genetically similar to cell-associated HIV RNA and the replication-competent virus within the detectable pool of latently infected, resting CD4+ T cells (11). Another study showed genetic differences between these populations (3). We hypothesized that the inability of sequential STIs to induce a vigorous immune response during chronic HIV infection might be due to the emergence of different viral variants with each interruption. Highly variable viral evolution between patients would also be consistent with the apparently contradictory results of Imamichi et al. (11) and Chun et al. (3). To test this hypothesis, we determined the pattern of evolution of viral populations sequenced from plasma RNA and peripheral blood mononuclear cell (PBMC) DNA at different time points following STIs.
The study included 12 adults with chronic HIV-1 infection who had suppressed viral loads during highly active antiretroviral therapy and who underwent four cycles of therapy interruption (6, 17). Each interruption lasted approximately 30 days and was followed by a treatment period of approximately 3 months to allow the virus to be suppressed to undetectable levels prior to the next interruption.
We compared the genetic relationships between different viral populations based on length polymorphisms in the V1-V2 and V4-V5 hypervariable regions of HIV-1 gp120 as previously described (20). The technique was adapted to be performed under denaturing conditions in a capillary electrophoresis analysis, and results were analyzed with GeneScan software (Applied Biosystems). The frequency of each length variant in a sample was calculated from the area of each peak divided by the total area of all the peaks. Very similar results were obtained when the peak heights were used to calculate the frequencies of each variant. Patient 9 was excluded from the analysis because she did not experience viral rebound during any of the four STIs in the protocol (17). The reproducibility of the results of the analysis was tested by performing two replicates on each of 15 samples, 7 with plasma RNA and 8 with PBMC DNA.
In order to estimate the degree of the diversity of length polymorphisms in each sample, we calculated Simpson's index of diversity for each region j (1 − Dj, where j is V1-V2 or V4-V5) from the frequency of each length variant (i) in a sample (xij) with the formula
 |
(1) |
where mj is the total number of length variants in region j. This is a composite measure of diversity (equal to 0 if there is no variation) that takes into account both the number and the frequency of peaks. The average diversity for each patient was summarized by calculating the median value of 1 minus D.
In order to estimate the degree of divergence between two samples from the frequency of each length variant, i, in region j in each population, xij and yij, we calculated the distance Da described by Nei et al. (12), given by the formula
 |
(2) |
In equation 2, r is the number of regions analyzed (here, r = 2). Software written to calculate these statistics is available on request. Wilcoxon-Mann-Whitney tests (for unpaired data) and Wilcoxon signed rank tests (for paired data) were used to analyze estimates of 1 minus D and Da; reported P values are exact and two sided.
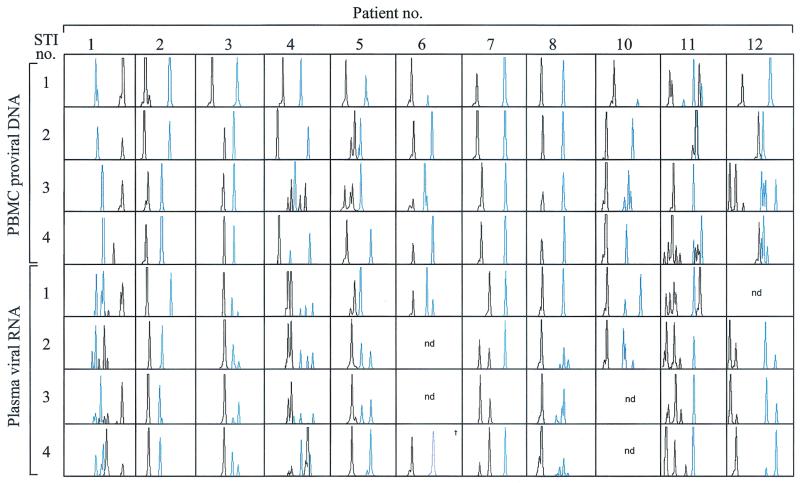
The patterns of length polymorphisms varied greatly among patients and sample types, ranging from relatively stable patterns (patients 2, 3, 6, 7, and 8) to highly variable patterns (patients 1, 4, 5, 10, 11, and 12) (Fig. 1). Variable patterns based on plasma RNA were not due to measurement error, as the same pattern of length variants (in terms of the number and lengths of variants) was detected when our assay was performed twice on seven plasma RNA samples. Although reproducibility was less for PBMC DNA, which showed artifactual changes in the number of variants in five out of eight PBMC samples, length variants detected in PBMC DNA were often not detected in RNA. Given the high reproducibility of our assay on RNA samples, this suggests the presence of genetic differences between plasma RNA and PBMC DNA in at least some of our patients. Only one patient (patient 8) had a highly stable pattern of both PBMC DNA and plasma RNA length polymorphisms during the entire study, although there was a moderate increase in the diversity of the V4-V5 fragment in the rebounding virus in this patient's plasma after the first STI (Fig. 1).
FIG. 1.
Length polymorphisms of the rebounding plasma virus in comparison with those isolated from PBMCs. Plasma RNA samples were collected at the peak of viremia during each STI, and cell-associated DNA samples were obtained the day before each STI was initiated, while viral load was below 50 copies/ml. RNA was reverse transcribed and PCR amplified in one step by using the QIAGEN OneStep reverse transcription-PCR kit. Nested PCR was performed with Platinum High Fidelity DNA polymerase (Gibco BRL). Results for the V1-V2 region are shown in black; those for the V4-V5 region are shown in blue. The size of each peak ranges between 250 and 350 nucleotides. nd, not determined; †, sample from the fifth STI was used because plasma viremia was less than 50 copies per ml during the fourth STI.
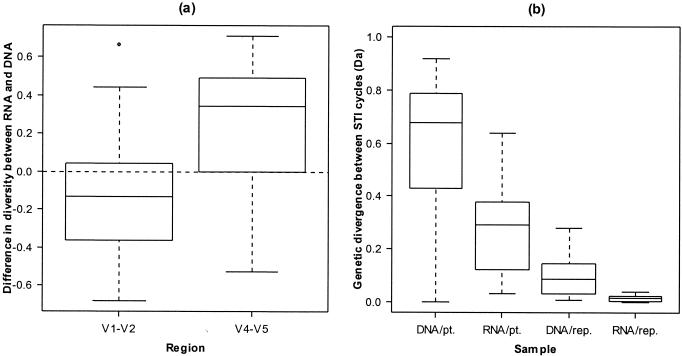
The overall degree of env diversity, measured by Simpson's index of diversity, showed that plasma RNA was more diverse than cell-associated proviral DNA in the V4-V5 region (median difference in 1 − D values for patients, 0.38; Wilcoxon signed rank test; P = 0.04) but not in the V1-V2 region (median difference in 1 − D values, −0.07; P = 0.1). As there were no systematic differences in diversity between replicates (median differences in 1 − D values, 0.02 and −0.02 for RNA and DNA, respectively), measurement error cannot account for the higher diversity of plasma RNA.
The divergence between samples from a patient, as measured by Nei et al.'s Da, was significantly higher between DNA populations (median Da = 0.68) than between RNA populations (median Da = 0.29) (Wilcoxon signed rank test; P = 0.004), and the divergence between RNA populations was in turn significantly greater than the divergence between DNA replicates (median Da = 0.09, Wilcoxon-Mann-Whitney test; P = 0.04), which in turn was significantly greater than the divergence between RNA replicates (median Da = 0.01, Wilcoxon-Mann-Whitney test; P = 0.01) (Fig. 2). As the level of divergence in our samples was significantly higher than the level of divergence generated by measurement error, this represents a real biological difference in diversity rather than a sampling artifact.
FIG. 2.
(a) Median differences in diversity across STI cycles between plasma RNA and PBMC DNA samples for the V1-V2 region and the V4-V5 region; (b) divergence over four therapy interruptions estimated by using PBMC DNA and plasma RNA samples from patients (DNA/pt. and RNA/pt., respectively). The divergence estimated from replicated assays on PBMC DNA and plasma RNA are also shown (DNA/rep. and RNA/rep., respectively).
To further analyze the evolution of rebounding HIV populations in plasma during STIs and in infected PBMCs, three patients were selected for extensive sequencing based on their different viral load kinetics in vivo during the course of the study (patients 4, 6, and 11). PCR amplification and sequence analysis were done as previously described (21), with the additional sequencing primers U7316env (5′-CTC AGG AGG GGA CCC AGA AA-3′) and L7344env (5′-CCT CCA CAA TTA AAA CTG TG-3′). Both DNA strands were sequenced in opposite directions. A total of 96 plasma RNA and PBMC DNA clonal sequences were obtained by endpoint dilution from the C2-V5 region within gp120. Sequences were aligned with the Clustal program (9), adjusted by manual editing, and trimmed to a total length of 759 bp (including gaps), corresponding to positions 6954 to 7682 in the reference strain HXB2. Samples were obtained at the same time points as those described for the length polymorphism technique. Available pretherapy population-based sequences were also included for all three patients.
Phylogenetic analysis was performed using a Bayesian approach with the MrBayes program (10), the output of which is a joint probability distribution of phylogenetic trees, branch lengths, and substitution rate parameters. Estimates of clustering were obtained by estimating the probability of a given cluster from a sample of 1,000 phylogenetic trees, analogous to bootstrap supports commonly used in phylogenetic analysis (5). The tree was rooted by using the population-based sequence obtained from plasma RNA prior to the treatment leading up to the interruption study.
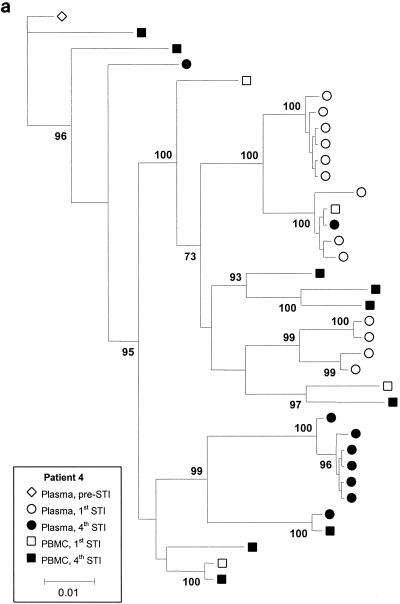
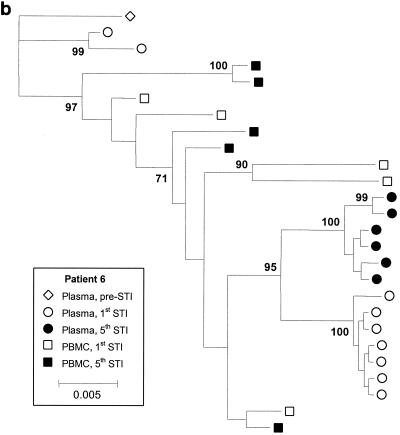
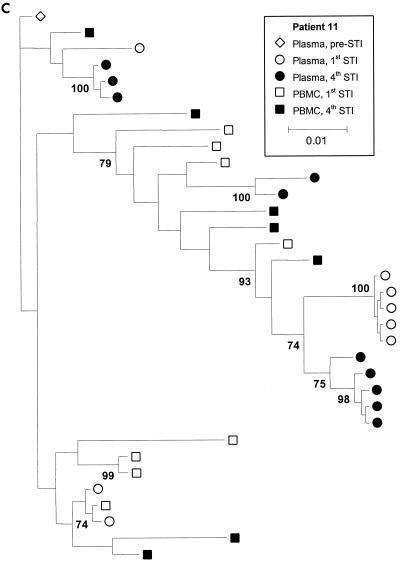
Figure 3 shows phylogenetic trees for patients 4, 6, and 11, with clusters labeled if their support was greater than 70%. Although there is sufficient sequence variation to identify several clusters of sequences within patients, these trees show that for all three patients, there is extensive intermingling of the sequences between DNA and RNA and between time points, with no apparent ordering in time. We also estimated the level of clustering between different subpopulations by calculating a correlation coefficient, r, between genetic distances and subpopulations, which ranges between −1 and 1 (4). High r values indicate clustering, and the statistical significance of these values was determined by a permutation test. We estimated r using numbers of nonsynonymous and synonymous differences per site, denoted dN and dS, with the method of Yang and Nielsen (19) and obtained the P value against the null hypothesis of no clustering using 10,000 permutations of the sequences between the subpopulations. This analysis revealed some statistically significant but weak clustering of sequences. Patient 4 showed statistically significant levels of clustering by STI but relatively little clustering by tissue (plasma versus PBMC) (Table 1). In contrast, patient 11 showed significant levels of clustering by tissue (plasma versus PBMC) but not STI. There was very little clustering by either STI or tissue (plasma versus PBMC) for patient 6, with the exception of nonsynonymous diversity between PBMC and plasma viruses. Inspection of the data revealed that this was due to a small number of amino acid substitutions between PBMC and plasma viruses (resulting in a slightly higher value for dN/dS between PBMC and plasma viruses) (Table 1).
FIG. 3.
Majority rule consensus trees for patients 4 (a), 6 (b), and 11 (c). Numbers at the nodes represent the percentages of support for the clusters. For patient 6, virus samples from the fifth STI were studied because the levels of the virus in plasma did not rebound during the fourth STI. Parameter values are as follows. A Hasegawa-Kishino-Yano (HKY) model of nucleotide substitution was assumed, with a uniform prior distribution and a range 3 to 6 assumed for the transition-transversion parameter. Base frequencies were fixed at their empirical estimates. The rate of heterogeneity was modeled as a mixture of invariant sites, at frequency p, with the substitution rates of the remaining sites following a discrete gamma distribution with shape parameter α. A Dirichlet distribution with parameter 1 (corresponding to a vague distribution) was assumed for p, and a uniform distribution (range, 0.05 to 0.5) was assumed for α.
TABLE 1.
Standardized generalized correlation coefficients (r values) between nonsynonymous and synonymous distances and pairs of subpopulations
| Patient | Subpopulations compared | dN/dSa | Diversity measure | Standardized GCC (r)b | P valuec |
|---|---|---|---|---|---|
| 4 | PBMC and plasma | 0.75/0.74 | dN | 0.07 | <0.05 |
| dS | 0.06 | <0.1 | |||
| 1st STI and 4th STI | 0.70/0.78 | dN | 0.34 | <0.001 | |
| dS | 0.16 | <0.001 | |||
| 6 | PBMC and plasma | 0.57/0.84 | dN | 0.30 | <0.001 |
| dS | −0.02 | NS | |||
| 1st STI and 5th STI | 0.68/0.72 | dN | 0.09 | <0.1 | |
| dS | 0.03 | NS | |||
| 11 | PBMC and plasma | 1.18/1.00 | dN | 0.17 | <0.001 |
| dS | 0.16 | <0.001 | |||
| 1st STI and 4th STI | 1.04/1.1 | dN | 0.08 | <0.05 | |
| dS | 0.01 | NS |
dN/dS ratios for within-population/between-population comparisons are given for each set of subpopulations compared.
GCC, generalized correlation coefficient. High values for r indicate clustering by subpopulation.
NS, not significant (P value > 0.1). The observed generalized correlation coefficient was greater than the simulated value.
Coreceptor usage plays a critical role in viral tropism, pathogenesis, and disease progression. It has been shown that there can be a viral population shift from X4 to R5 after treatment, independent of changes in the level of HIV-1 RNA in plasma and the CD4+-cell count (15). Although most of the patients in our study did not meet the clinical definition of having advanced disease, they had been infected for up to 13 years (17). Thus, we used U87.CD4 cells transfected with CCR5 or CXCR4 (2) to investigate whether coreceptor usage changed during our sequential STI study. Viral strains from 11 of the 12 patients were R5 at the first STI and maintained their predicted phenotype over the four STI cycles. Only viruses isolated from patient 8 were able to infect cells expressing either CCR5 or CXCR4, and this phenotype was stable over the study period.
Our results show that HIV can evolve in a highly unpredictable fashion during STIs. It is not clear whether the evolution of HIV during STIs is driven by selection pressure or is simply due to chance effects arising as a consequence of outgrowth from a small population. The strengthening of HIV-specific cell-mediated immune responses might be limited in chronically infected patients because the exposed viral antigens keep changing over sequential STIs. These observations contrast with the low degree of viral genetic diversity seen in patients treated during early infection and who later discontinued therapy (1, 20). Thus, a less diverse virus population along with conserved HIV-1-specific CD4+-T-cell responses might contribute to increased virus-specific cytotoxic T lymphocytes and ultimately keep viremia under control (1, 16). However, although the changes in viral genetic variation demonstrated in this study are consistent with this hypothesis, it does not necessarily imply that there are changes in viral epitopes. Detailed studies of the kinetics of the HIV-specific immune response are required to explicitly address this hypothesis.
Nucleotide sequence accession numbers.
The sequences reported herein have been submitted to the EMBL data bank under accession numbers ALIGN_000324 to ALIGN_000326.
Acknowledgments
This study was supported in part by grants FIS 01/1122, FIPSE 3025/99, and FIPSE 36177/01 and by the program Gaspar de Portolà 2001, a collaboration between Catalonia and California. J.M.-P. was supported by contract FIS 99/3132 from the Fundacio per a la Recerca Biomedica Germans Trias i Pujol in collaboration with the Spanish Health Department. S.D.W.F. was supported by the National Institutes of Health (grant AI47745) and by a UCSD Center for AIDS Research developmental award (NIAID 2 P30 AI 36214).
U87.CD4 cells transfected with CCR5 or CXCR4 were obtained from H. Deng and D. Littman through the AIDS Research and Reference Reagent Program, Division of AIDS, NIAID, NIH. We thank M. A. Martínez for critically reading the manuscript.
REFERENCES
- 1.Altfeld, M., E. S. Rosenberg, R. Shankarappa, J. S. Mukherjee, F. M. Hecht, R. L. Eldridge, M. M. Addo, S. H. Poon, M. N. Phillips, G. K. Robbins, P. E. Sax, S. Boswell, J. O. Kahn, C. Brander, P. J. Goulder, J. A. Levy, J. I. Mullins, and B. D. Walker. 2001. Cellular immune responses and viral diversity in individuals treated during acute and early HIV-1 infection. J. Exp. Med. 193:169-180. [DOI] [PMC free article] [PubMed] [Google Scholar]
- 2.Björndal, Å., H. Deng, M. Jansson, J. R. Fiore, C. Colognesi, A. Karlsson, J. Albert, G. Scarlatti, D. R. Littman, and E. M. Fenyö. 1997. Coreceptor usage of primary human immunodeficiency virus type 1 isolates varies according to biological phenotype. J. Virol. 71:7478-7487. [DOI] [PMC free article] [PubMed] [Google Scholar]
- 3.Chun, T. W., R. T. Davey, Jr., M. Ostrowski, J. Shawn Justement, D. Engel, J. I. Mullins, and A. S. Fauci. 2000. Relationship between pre-existing viral reservoirs and the re-emergence of plasma viremia after discontinuation of highly active anti-retroviral therapy. Nat. Med. 6:757-761. [DOI] [PubMed] [Google Scholar]
- 4.Critchlow, D. E., S. Y. Li, K. Nourijelyani, and D. K. Pearl. 2000. Some statistical methods for phylogenetic trees with application to HIV disease. Math. Comput. Model. 32:69-81. [Google Scholar]
- 5.Efron, B., E. Halloran, and S. Holmes. 1996. Bootstrap confidence levels for phylogenetic trees. Proc. Natl. Acad. Sci. USA 93:13429-13434. [DOI] [PMC free article] [PubMed] [Google Scholar]
- 6.Frost, S. D. W., J. Martinez-Picado, L. Ruiz, B. Clotet, and A. J. Leigh Brown. 2002. Viral dynamics during structured treatment interruptions of chronic human immunodeficiency virus type 1 infection. J. Virol. 76:968-979. [DOI] [PMC free article] [PubMed] [Google Scholar]
- 7.Garcia, F., M. Plana, C. Vidal, A. Cruceta, W. A. O'Brien, G. Pantaleo, T. Pumarola, T. Gallart, J. M. Miro, and J. M. Gatell. 1999. Dynamics of viral load rebound and immunological changes after stopping effective antiretroviral therapy. AIDS 13:F79-F86. [DOI] [PubMed] [Google Scholar]
- 8.Harrigan, P. R., M. Whaley, and J. S. G. Montaner. 1999. Rate of HIV-1 RNA rebound upon stopping antiretroviral therapy. AIDS 13:F59-F62. [DOI] [PubMed] [Google Scholar]
- 9.Higgins, D. G., J. D. Thompson, and T. J. Gibson. 1996. Using CLUSTAL for multiple sequence alignments. Methods Enzymol. 266:383-402. [DOI] [PubMed] [Google Scholar]
- 10.Huelsenbeck, J. P., and F. Ronquist. 2001. MRBAYES: Bayesian inference of phylogenetic trees. Bioinformatics 17:754-755. [DOI] [PubMed] [Google Scholar]
- 11.Imamichi, H., K. A. Crandall, V. Natarajan, M. K. Jiang, R. L. Dewar, S. Berg, A. Gaddam, M. Bosche, J. A. Metcalf, R. T. Davey, Jr., and H. C. Lane. 2001. Human immunodeficiency virus type 1 quasi species that rebound after discontinuation of highly active antiretroviral therapy are similar to the viral quasi species present before initiation of therapy. J. Infect. Dis. 183:36-50. [DOI] [PubMed] [Google Scholar]
- 12.Nei, M., F. Tajima, and Y. Tateno. 1983. Accuracy of estimated phylogenetic trees from molecular data. II. Gene frequency data. J. Mol. Evol. 19:153-170. [DOI] [PubMed] [Google Scholar]
- 13.Neumann, A. U., R. Tubiana, V. Calvez, C. Robert, T.-S. Li, H. Agut, B. Autran, C. Katlama, and the Comet Study Group. 1999. HIV-1 rebound during interruption of highly active antiretroviral therapy has no deleterious effect on reinitiated treatment. AIDS 13:677-683. [DOI] [PubMed] [Google Scholar]
- 14.Papasavvas, E., G. M. Ortiz, R. Gross, J. Sun, E. C. Moore, J. J. Heymann, M. Moonis, J. K. Sandberg, L. A. Drohan, B. Gallagher, J. Shull, D. F. Nixon, J. R. Kostman, and L. J. Montaner. 2000. Enhancement of human immunodeficiency virus type 1-specific CD4 and CD8 T cell responses in chronically infected persons after temporary treatment interruption. J. Infect. Dis. 182:766-775. [DOI] [PubMed] [Google Scholar]
- 15.Philpott, S., B. Weiser, K. Anastos, C. M. Kitchen, E. Robison, W. A. Meyer III, H. S. Sacks, U. Mathur-Wagh, C. Brunner, and H. Burger. 2001. Preferential suppression of CXCR4-specific strains of HIV-1 by antiviral therapy. J. Clin. Investig. 107:431-438. [DOI] [PMC free article] [PubMed] [Google Scholar]
- 16.Rosenberg, E. S., M. Altfeld, S. H. Poon, M. N. Phillips, B. M. Wilkes, R. L. Eldridge, G. K. Robbins, R. T. D'Aquila, P. J. Goulder, and B. D. Walker. 2000. Immune control of HIV-1 after early treatment of acute infection. Nature 407:523-526. [DOI] [PubMed] [Google Scholar]
- 17.Ruiz, L., G. Carcelain, J. Martinez-Picado, S. Frost, S. Marfil, R. Paredes, J. Romeu, E. Ferrer, K. Morales-Lopetegi, B. Autran, and B. Clotet. 2001. HIV dynamics and T-cell immunity after three structured treatment interruptions in chronic HIV-1 infection. AIDS 15:F19-F27. [DOI] [PubMed] [Google Scholar]
- 18.Ruiz, L., J. Martinez-Picado, J. Romeu, R. Paredes, M. K. Zayat, S. Marfil, E. Negredo, G. Sirera, C. Tural, and B. Clotet. 2000. Structured treatment interruption in chronically HIV-1 infected patients after long-term viral suppression. AIDS 14:397-403. [DOI] [PubMed] [Google Scholar]
- 19.Yang, Z., and R. Nielsen. 2000. Estimating synonymous and nonsynonymous substitution rates under realistic evolutionary models. Mol. Biol. Evol. 17:32-43. [DOI] [PubMed] [Google Scholar]
- 20.Zhang, L., C. Chung, B. S. Hu, T. He, Y. Guo, A. J. Kim, E. Skulsky, X. Jin, A. Hurley, B. Ramratnam, M. Markowitz, and D. D. Ho. 2000. Genetic characterization of rebounding HIV-1 after cessation of highly active antiretroviral therapy. J. Clin. Investig. 106:839-845. [DOI] [PMC free article] [PubMed] [Google Scholar]
- 21.Zhang, L., B. Ramratnam, K. Tenner-Racz, Y. He, M. Vesanen, S. Lewin, A. Talal, P. Racz, A. S. Perelson, B. T. Korber, M. Markowitz, D. D. Ho, Y. Guo, M. Duran, A. Hurley, J. Tsay, Y. C. Huang, and C. C. Wang. 1999. Quantifying residual HIV-1 replication in patients receiving combination antiretroviral therapy. N. Engl. J. Med. 340:1605-1613. [DOI] [PubMed] [Google Scholar]


