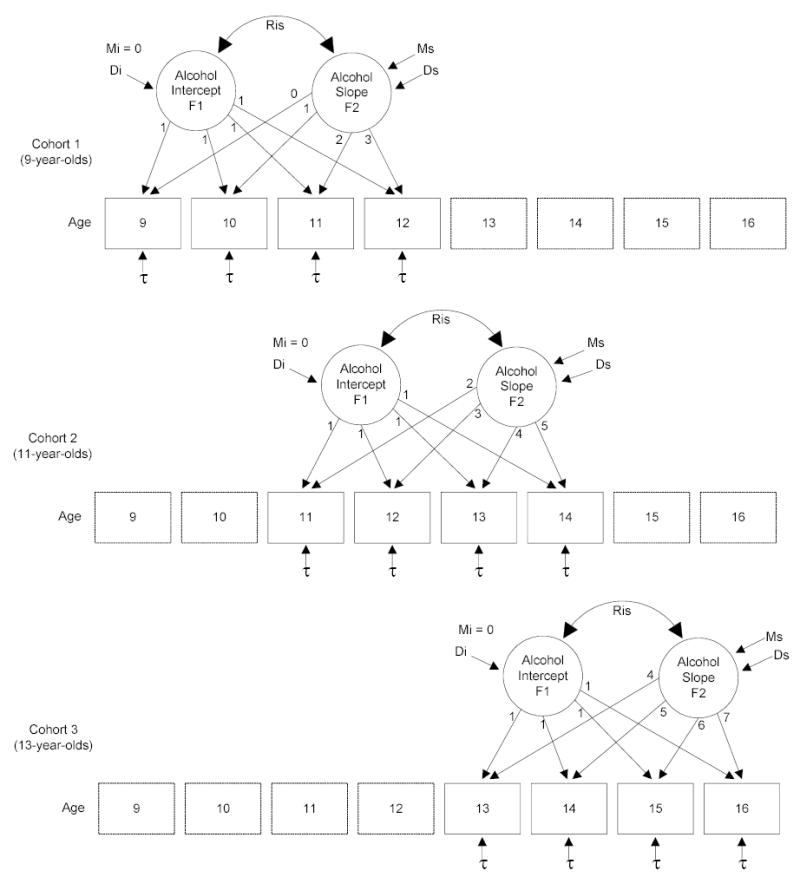
Figure 1.

Representation of the cohort-sequential LGM for change in adolescent alcohol use from ages 9 to 16 years. Cohort 1 represents the 9-year-old cohort with data for ages 9, 10, 11, and 12 years across years 1 to 4, respectively. Cohort 2 represents the 11-year-old cohort with data for ages 11, 12, 13, and 14 years. Cohort 3 represents the 13-year-old cohort with data for ages 13, 14, 15, and 16 years. Boxes with dotted lines represent the “missing” data by design for each cohort. F1 represents Factor 1, the intercept, and F2 represents Factor 2, the slope. The mean of the slope, Ms, and variances of the intercept, Di, and slope, Ds, as well as the correlation, Ris, between the intercept and slope, are estimated. The mean of the intercept, Mi, is fixed at 0. Thresholds for each observed variable are estimated and constrained to be equal across time and cohort. A linear growth trajectory is specified by fixing the factor loadings on the slope from 0–7 across ages 9–16 years.
