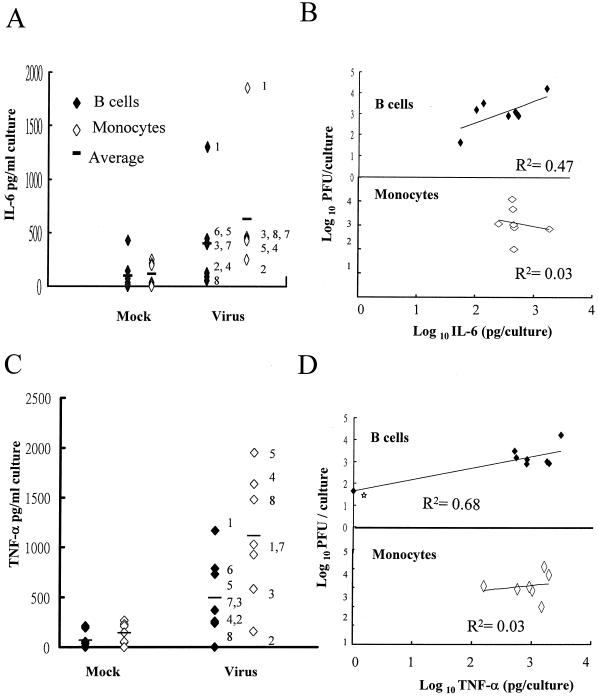
FIG. 5.
Cytokine production in DV-infected human mononuclear cells. The same 48-h supernatant samples used for virus titration in Fig. 1A and their corresponding mock-treated samples of B cells (solid diamonds) and monocytes (open diamonds) were assayed for IL-6 (A) and TNF-α (C) by using ELISA kits. Numbers adjacent to symbols represent individual donors, and bars represent mean values for each group. (B and D) Correlation of IL-6 and virus production (B) and correlation of TNF-α and virus production (D) in infected B cells (top) and monocytes (bottom). The amounts of the indicated cytokines produced in the infected samples were plotted against the amounts of virus produced in the same samples. The best-fit lines were generated by linear regression of log10 values. Star, virus production in B cells for donor 8.

