
Figure 3.
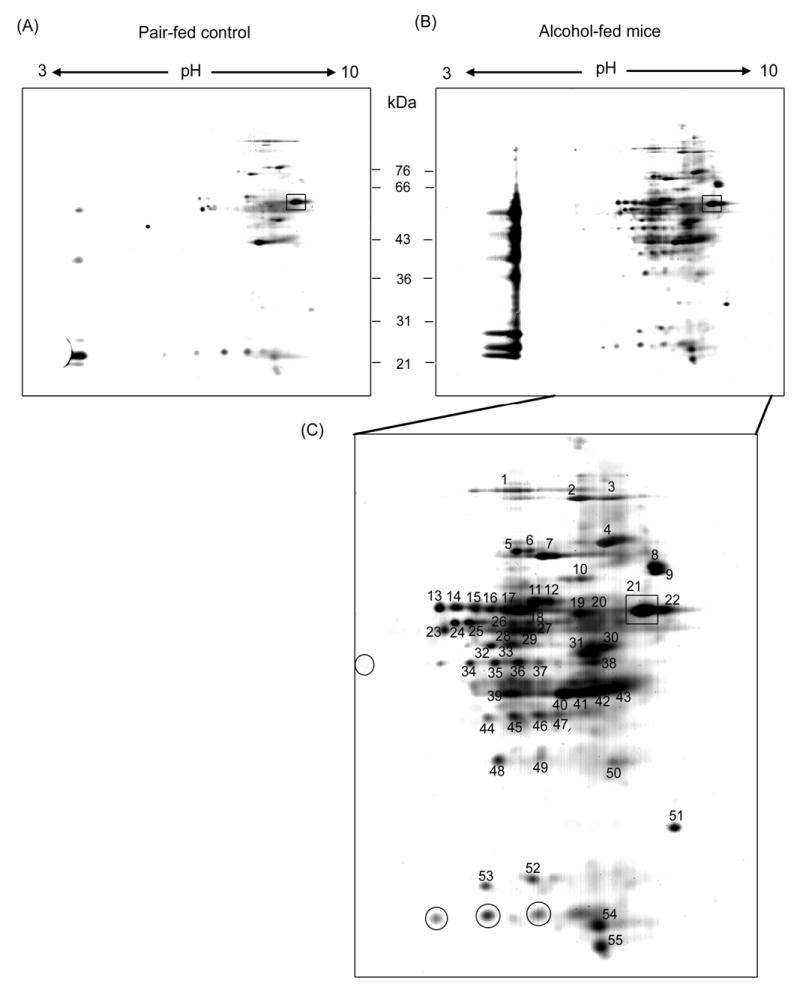
Separation of biotin-NM labeled cytosolic proteins from mouse livers by 2-DE. Biotin-NM labeled cytosolic proteins from pair-fed control (A) and alcohol-fed mouse livers (B) were purified with streptavidin-agarose, resolved by 2-DE gels, and silver stained. Individual protein spots (spot 1-55) with differential intensities were marked with different numbers, excised out of this particular gel (pH range 3 - 10), and subjected to MS analysis following in-gel trypsin digestion. Spot 21, designated with a square, was used as an internal standard for comparison purpose between the two different gels for pair-fed control and alcohol-fed mouse livers. Protein spots with similar or decreased intensities after alcohol exposure are designated with circles in Fig. 3C.