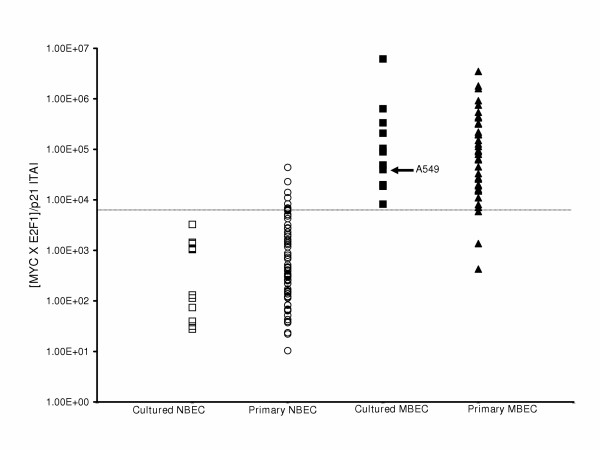
Figure 1.
Histogram analysis of the [MYC × E2F1]/p21 ITAI. Each data set comprises either cultured or primary normal bronchial epithelial cell (NBEC) or cultured or primary malignant bronchial epithelial cell (MBEC) samples assessed for the ITAI. The ITAI cut-off is indicated by the horizontal line at 7,000 molecules. Parental A549 is indicated.

