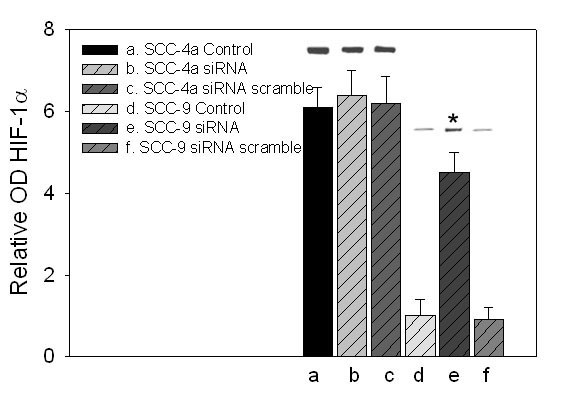
Figure 6.

The relative optical density of HIF-1α proteins from Western blots. SCC-4a and SCC-9 cells were treated with 20 ng of siRNA directed against TSC2. A TSC2 scramble was included as an internal control and verified by Western blotting (not shown). The cells were exposed for 30 minutes to EGF and then lysed. Representative gel bands corresponding to HIF-1α are immediately depicted above the bar graph. (*, P < 0.05)
