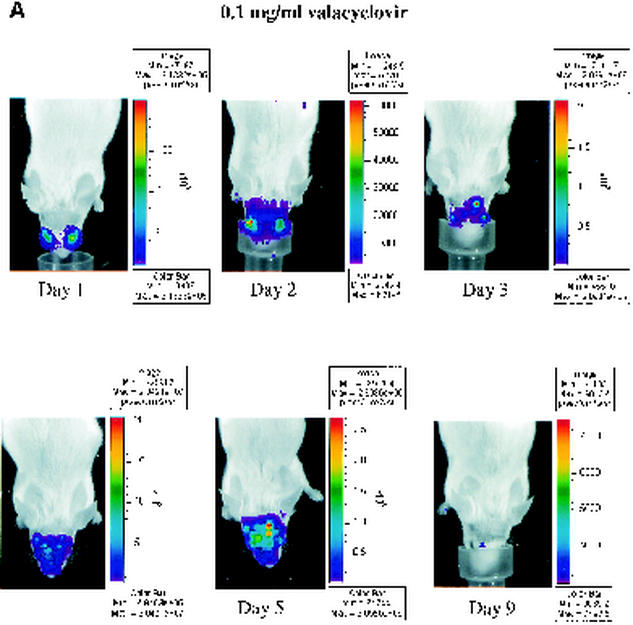
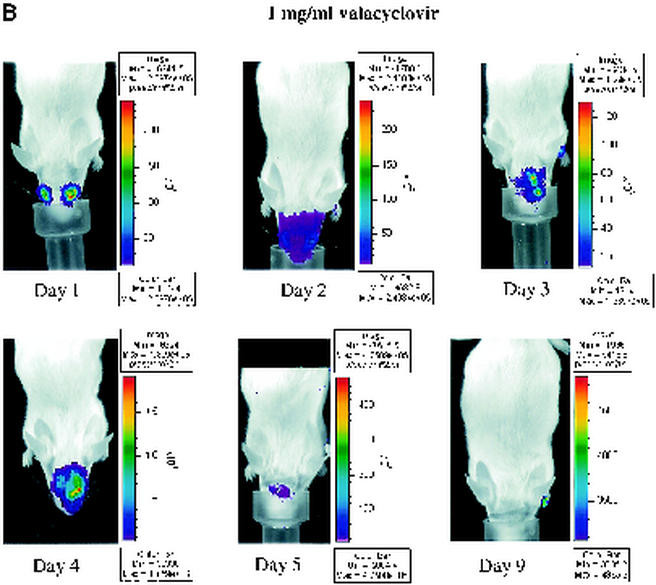
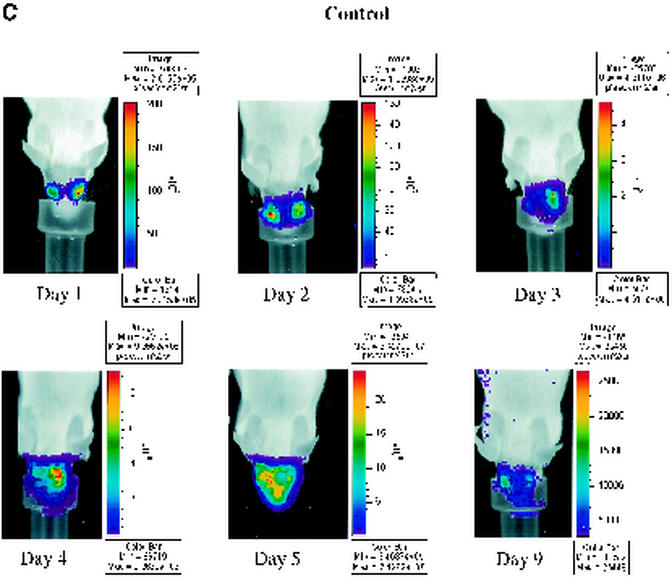
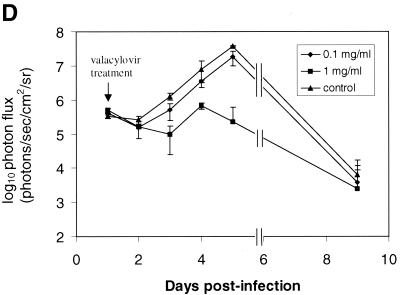
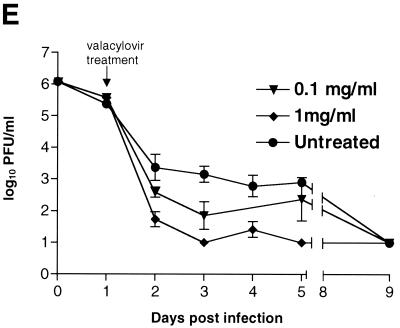
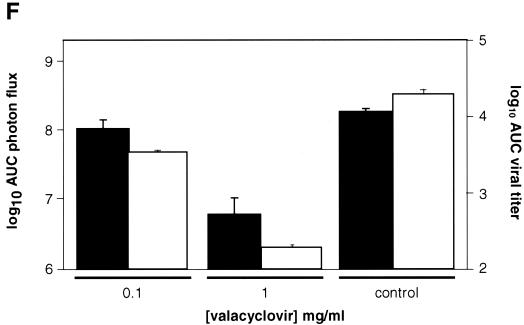
FIG. 5.
Time course of KOS/Dlux/oriL infection in response to treatment with valacyclovir. Mice were infected with 2 × 10⁶ PFU KOS/Dlux/oriL by corneal scarification, and treatment with valacyclovir at 0.1 mg/ml (n = 4), 1 mg/ml (n = 4), or vehicle control (n = 5) in drinking water was started after imaging on day 1 day postinfection. Sequential bioluminescence images and eye swabs for tear film material were obtained on days 1 to 5 and 9 of infection. Representative images of mice in the 0.1-mg/ml valacyclovir (A), 1-mg/ml valacyclovir (B), and control groups (C) are presented. The mean ROI values for photon flux (D) and viral titers (E) in each group are shown. The arrow denotes the start of valacyclovir treatment after imaging and culturing tear films on day 1 postinfection. (F) AUC analyses for photon flux (black bars) and viral titers from tear films (open bars) for each cohort of mice.

