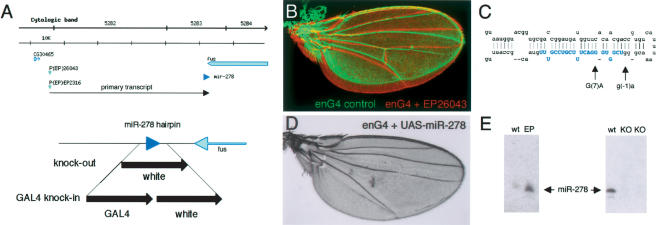
Figure 1.
The miR-278 locus. (A) Schematic representation of the miR-278 locus. (Top) Overview of the genomic region (bar, 10 kb). P(EP)26043 and P(EP)EP2316 produced the tissue overgrowth phenotype shown in B. Both are ∼45 kb from the miR-278 sequence (blue arrowhead). (Bottom) Detail of the miR-278 region. miR-278 is located 300 bp from the 3′ end of the fus transcript. “knock-out” indicates the region replaced with the mini-white gene by homologous recombination; “Gal4 knock-in,” indicates the same region replaced by Gal4 and mini-white. (B) Adult wings from an engrailedGal4 control fly (green) and a fly expressing miR-278 in the posterior compartment under engrailedGal4 control from EP26043 (red). The wings are aligned in the anterior to show overgrowth of the posterior compartment expressing miR-278. (C) The predicted miR-278 hairpin, showing mutations identified as EMS-induced revertants of the overexpression phenotype. Blue shading indicates mature miR-278. (D) Adult wing expressing UAS-miR-278 in the posterior compartment under engrailedGal4 control. Note the more severe overgrowth and loss of the posterior cross-vein caused by UAS-miR-278. This resembles the phenotype of expanded mutant wings (not shown). (E) Northern blots showing miR-278 RNA. (Left) Overexpression in tubulinGal4 EP26043 flies compared with wild-type controls. (Right) Loss of miR-278 RNA in homozygous knock-out mutant flies (two independent isolates) compared with wild type. Thirty micrograms of total RNA per lane.

