
Figure 1.
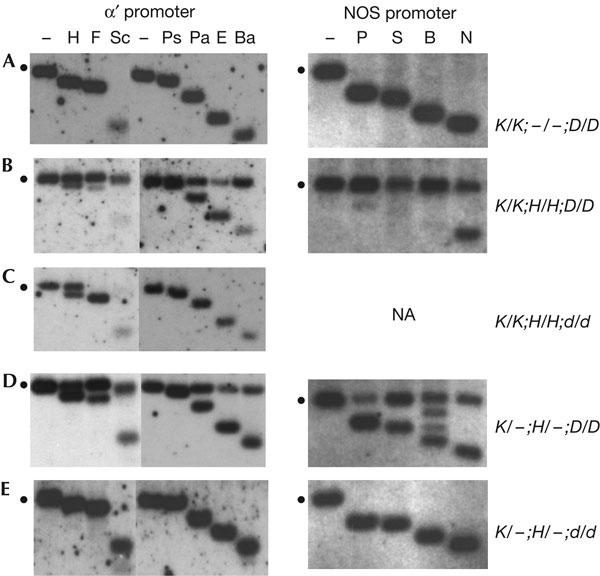
Analysis of de novo methylation. Methylation of the target α′ promoter was analysed using restriction enzymes diagnostic for non-CG methylation (F, Sc, Ps, Pa, E, Ba) or CG methylation (H). Methylation of the nopaline synthase (NOS) promoter was analysed using restriction enzymes diagnostic for non-CG methylation (N), CG methylation (P, B) or both (S). The respective methylationsensitive enzymes were added after a standard digest with non-methylation-sensitive restriction enzymes (‘−' lanes). The position of the methylated fragment is denoted by the dots to the left of each blot. Shifts to the smaller fragment(s) indicate no methylation at the site(s) tested. Maps of the promoters showing positions of restriction enzyme sites and the probes used for hybridization are depicted in supplementary Fig 1 online. Genotypes of the plants analysed are shown to the right; dashes indicate a hemizygous transgene locus. Bold letters to the left represent boxed genotypes shown in the breeding schemes in Fig 2. Abbreviations: K, target complex; H, silencer complex; d, drd1-6 mutant; D, wild type; NA, not applicable. Abbreviations of enzymes and their recognition sequences (sensitivity to C methylation indicated by the superscript ‘m'): α′ promoter: B, BstUI (mCGmCG); Ba, BamHI (GGATmCmC); E, EcoT22I (ATGmCAT); F, Fnu4HI (GmCmNGmC, if N is C); H, HpyCH4IV (AmCGT); NOS promoter: N, NheI (GCTAGmC); P, Psp1406I (AAmCGTT); Pa, PagI (TmCATGA); Ps, PstI (mCTGmCAG); S, SacII (mCmCGmCGG); Sc, ScrF1 (CmCmNGG (if N is C).