
Figure 4.
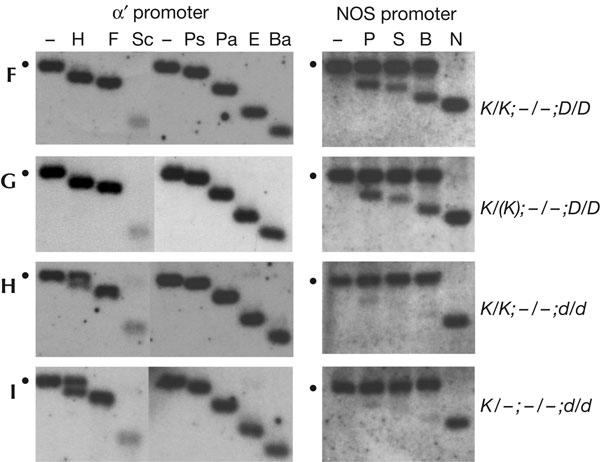
Maintenance methylation analysis. Methylation of the target promoter at the respective K complex (α′ promoter (left) and nopaline synthase (NOS) promoter (right)) after segregating away the respective silencer H complex was studied using methylationsensitive restriction enzymes as described in the legend to Fig 1. The genotypes of the plants analysed are shown to the right. The bold letters to the left represent the boxed genotypes shown in the breeding scheme in Fig 2. ‘K/(K)' denotes both homozygous K/K and hemizygous K/− plants. The plants shown in (G,H,I) are siblings.