
Figure 2.
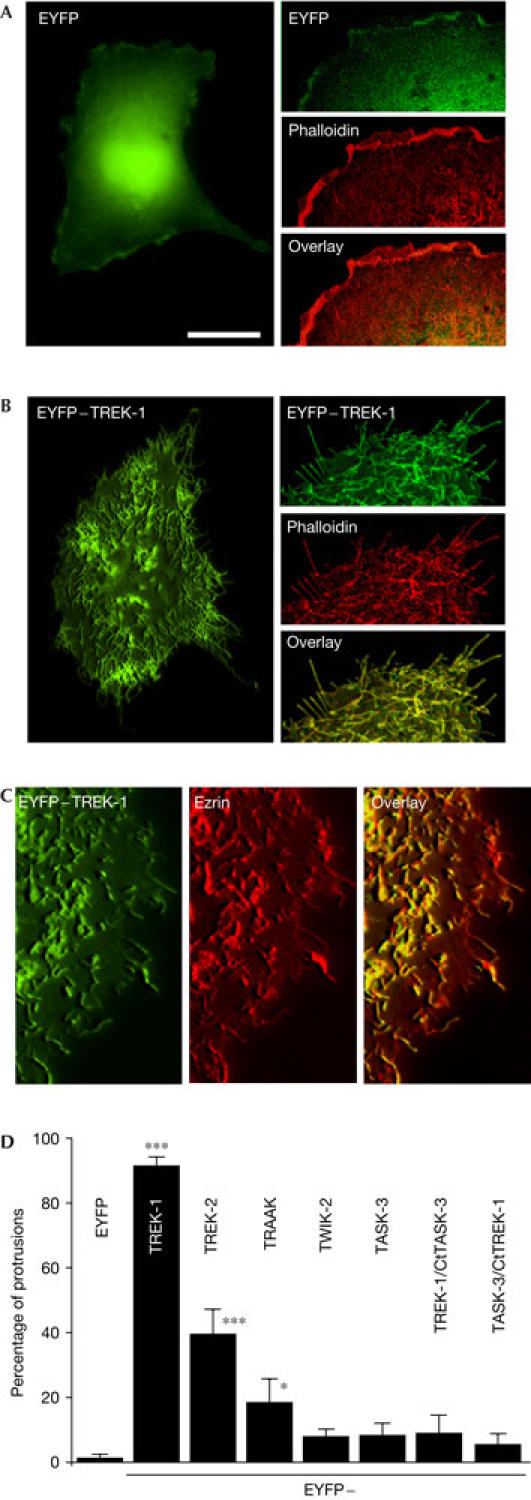
Induction of filopodia-like structures by expression of TREK-1 in COS7 cells. (A) Left panel: epifluorescence three-dimensional (3D) image of an EYFP (enhanced yellow fluorescent protein)-transfected cell. (B) Left panel: epifluorescence 3D image of an EYFP–TREK-1 transfected cell. (A,B) Right panels: confocal images of EYFP- or EYFP–TREK-1-transfected cells stained with Alexa Fluor® 594 phalloidin. The overlay between EYFP and phalloidin staining is shown in the bottom panel. (C) Epifluorescence images of an EYFP–TREK-1-expressing cell immunolabelled with an antibody against ezrin. Ezrin labelling was detected using goat anti-rabbit Alexa Fluor® 594. The overlay of EYFP–TREK-1 and ezrin is depicted on the right. (D) Quantification of COS7 cells transfected with various EYFP-tagged K2P channels and TREK-1/TASK-3 and TASK-3/TREK-1 chimaeras (see the supplementary information online). The histogram represents the percentage of cells in which channel proteins are localized to membrane protrusions. A total of 120 cells from three to four independent experiments were counted blind. Scale bars, 25 μm (A,B (left panels)) and 10 μm (A,B (right panels), C).