Figure 2.

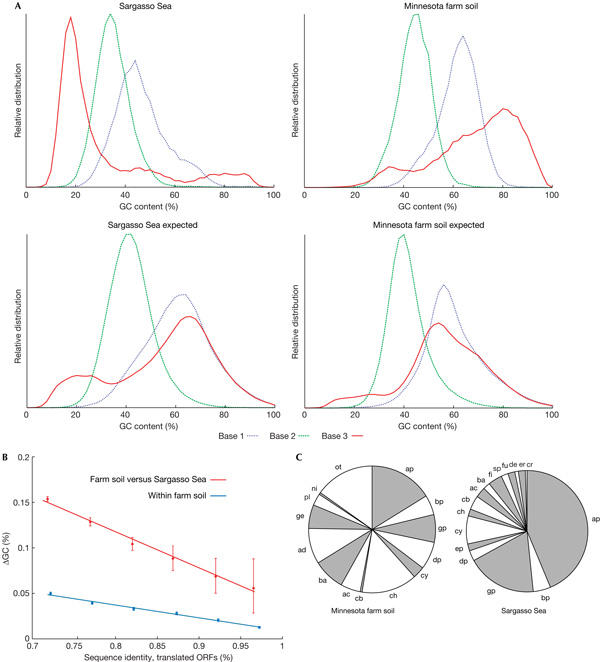
Guanine and cytosine content analysis of open reading frames. (A) Deviation from expectation. Guanine and cytosine (GC) content distributions are shown for each environmental sample, separately for each codon position. The curves are compared with the expected distributions; the latter were derived from known genomes by sampling their DNA in amounts matching the overall phylogenetic compositions reported for the samples. (B) GC-content differences for paired open reading frames (ORFs) of high sequence similarity (that is, recent divergence). ORFs were paired on the basis of reciprocal best matches in BLAST searches (see supplementary Figure 3 online for more details). Error bars denote 90% confidence intervals of the mean. (C) Phylogenetic distributions of organisms, as reported from 16S ribosomal RNA analysis, for two principal samples. Note the wide range of phyla present. ac, Actinobacteria; ad, Acidobacteria; ap, α-Proteobacteria; ba, Bacteriodetes; bp, β-Proteobacteria; cb, Chlorobi; ch, Chloroflexi; cr, Crenarchaeota; cy, Cyanobacteria; de, Deinococcus-Thermus; dp, δ-Proteobacteria; ep, ɛ-Proteobacteria; er, Eryarchaeota; fi, Firmicutes; fu, Fusobacteria; ge, Gemmatimonadetes; gp, γ-Proteobacteria; ni, Nitrospira; ot, others; pl, Planctomycetes; sp, Spirochaetes.
