
Figure 2.
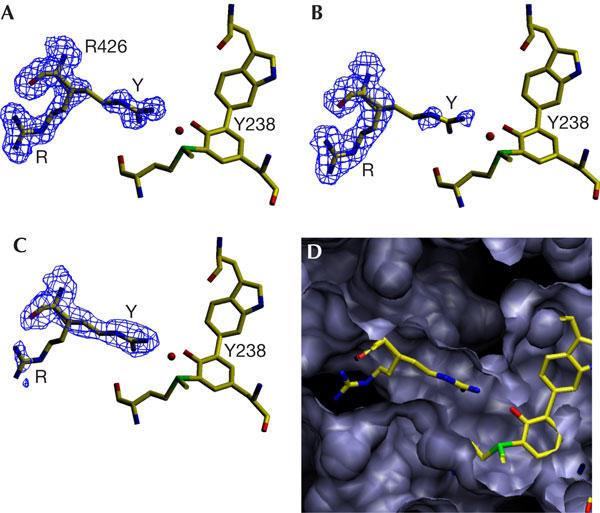
View of the 2Fo−Fc electron density maps in the vicinity of Arg 426 modelled at σ=1.0. (A) BpKatG at pH 5.6 exhibits conformations R and Y at a ratio of approximately 70:30. (B) BpKatG soaked with peroxoacetic acid as in Figure 1 exhibits 100% conformation R. (C) Native BpKatG at pH 8.0 exhibits 100% conformation Y. Panel (D) shows the cavity containing Arg 426 including the two conformations of the Arg 426 side chain.