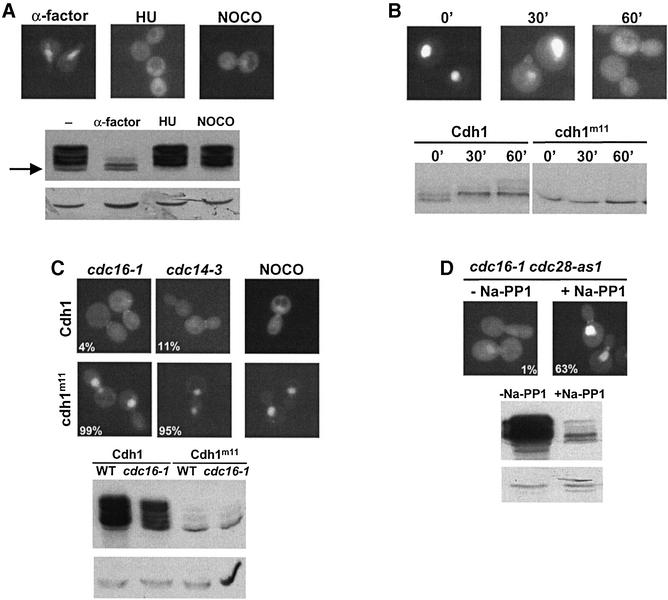
Fig. 2. Phosphorylation of Cdh1p by Cdc28p regulates its subcellular localization. (A) The localization of Cdh1p–GFP was analysed by GFP microscopy in wild-type cells arrested in G1 with α-factor, in S phase with HU or in mitosis with nocodazole (NOCO). The phosphorylation state of HA3-Cdh1p was analysed by immunoblotting (lower panel). The arrow points to the position of unphosphorylated Cdh1p-HA. Immunoblotting with antibodies against actin confirms equal loading of the gel (lower blot). (B) cln1,2,3 pMETCLN2 (EY569) cells expressing Cdh1p–GFP from the ADH1 promoter (upper panel) or HA3-Cdh1p from the GAL1 promoter (lower panel) were arrested in G1 by depletion of Cln2p (time = 0), and released by expression of Cln2p. Aliquots were analysed after the times indicated by GFP microscopy (upper images) or immunoblotting (lower blot). Cells expressing non-phosphorylatable HA3-Cdh1p-m11 were included as a control. (C) cdc16-1 (YMP190), cdc14-3 (YMP809) or wild-type (K699) cells arrested with NOCO expressing either wild-type Cdh1p or non-phosphorylatable Cdh1p-m11 fused to GFP (upper panels) were arrested at the metaphase–anaphase transition or after anaphase, respectively, by shifting the temperature to 37°C for 2 h, and analysed by GFP microscopy. Numbers indicate the percentage of cells with nuclear accumulation of Cdh1p–GFP; at least 200 cells were included in the analysis. For control, the phosphorylation state of HA3-Cdh1p or HA3-Cdh1p-m11 was analysed in wild-type or cdc16-1 cells by immunoblotting (upper blot). Immunoblotting with antibodies against actin controls for the loading of the gel (lower blot). (D) Inhibition of Cdc28 kinase activity is sufficient for nuclear accumulation of Cdh1p–GFP. cdc16-1 cdc28-as1 cells (YMJ1055) expressing Cdh1p–GFP were arrested in mitosis by shifting to 37°C. After 90 min, the culture was divided: one half was incubated with the drug Na-PP1 specifically to inhibit Cdc28p-as1 (+Na-PP1), while only the solvent DMSO was added to the other half (–Na-PP1). The localization of Cdh1p–GFP was analysed by GFP microscopy after 90 min. Numbers indicate the percentage of cells with nuclear accumulation of Cdh1p–GFP; at least 200 cells were included in the analysis. For control, the phosphorylation state of HA3-Cdh1p was examined in cdc16-1 cdc28-as1 cells by immunoblotting (lower panel). An immunoblot against actin (arrow) controls for equal loading (lower blot).

An official website of the United States government
Here's how you know
Official websites use .gov
A
.gov website belongs to an official
government organization in the United States.
Secure .gov websites use HTTPS
A lock (
) or https:// means you've safely
connected to the .gov website. Share sensitive
information only on official, secure websites.
