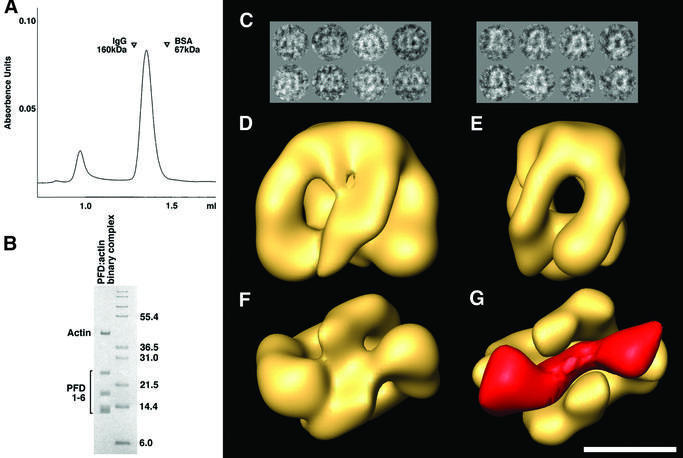
Fig. 2. Generation of the PFD:actin complex and its three-dimensional reconstruction. (A) Isolation of PFD:actin complexes by gel filtration on Superdex 200. The locations of molecular mass markers run on the same column are shown. (B) Analysis by SDS–PAGE of material in the peak shown in (A) migrating with an apparent Mr of ∼100 kDa. Molecular mass markers (in kDa) are shown on the right. (C) A gallery of negatively stained images similar to those used for the three-dimensional reconstruction of the PFD:actin complex. The two main views are depicted. (D–F) Front, side and bottom views, respectively, of the three-dimensional reconstruction of the PFD:actin complex. (G) The volume of substrate-free PFD (solid yellow) placed in the same bottom view as the PFD:actin complex depicted in (F). The mass shown in red corresponds to the difference between the PFD:actin complex and substrate-free PFD, and is very suggestive of actin existing in an open conformation, traversing the PFD cavity and interacting with the tips of the tentacles. Scale bar = 50 Å.

An official website of the United States government
Here's how you know
Official websites use .gov
A
.gov website belongs to an official
government organization in the United States.
Secure .gov websites use HTTPS
A lock (
) or https:// means you've safely
connected to the .gov website. Share sensitive
information only on official, secure websites.
