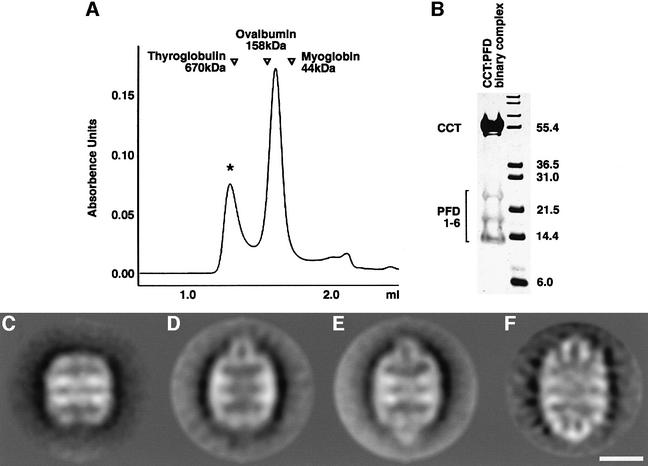
Fig. 3. Two-dimensional averages of CCT:PFD complexes. (A) Gel filtration on Superose 6 of the products resulting from co-incubation of CCT and PFD. The location of molecular size markers run on the same column under identical conditions is shown. (B) Analysis by SDS–PAGE of the products contained in the peak [marked with an asterisk in (A)] emerging from the column with an apparent Mr of ∼700 kDa. Note the presence of polypeptides characteristic of both CCT (in the size range around 55 kDa) and PFD (in the size range 14–25 kDa). (C) Average image obtained from negatively stained CCT particles in the absence of PFD (average image obtained from 350 particles; 27 Å resolution). (D) Average image obtained from negatively stained particles of CCT:PFD asymmetric complexes and (E) symmetric complexes (average images of 561 and 1128 particles; 27 and 24 Å resolution, respectively) (F) Average image of the CCT:PFD symmetric complex obtained from frozen-hydrated specimens (715 particles; 25 Å resolution). Scale bar = 100 Å.

An official website of the United States government
Here's how you know
Official websites use .gov
A
.gov website belongs to an official
government organization in the United States.
Secure .gov websites use HTTPS
A lock (
) or https:// means you've safely
connected to the .gov website. Share sensitive
information only on official, secure websites.
