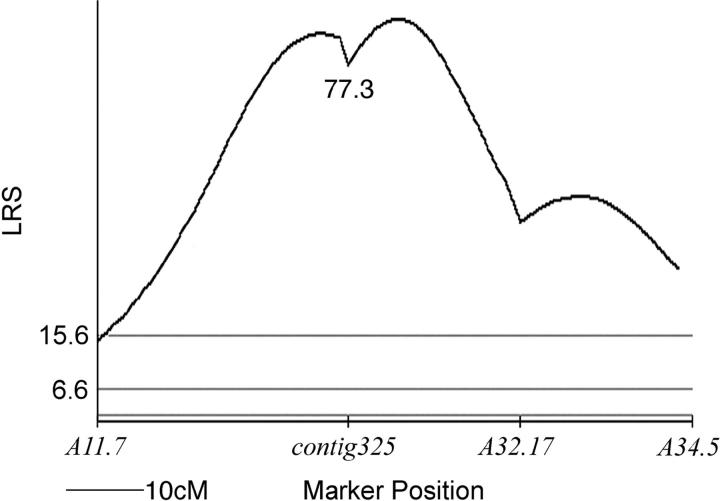
Figure 2.—
Likelihood-ratio statistic (LRS) plot for association of paedomorphosis with genetic factors in the met QTL region. The LRS for the contig325 marker is shown. Horizontal shaded lines represent LRS thresholds for suggestive (1.3), significant (6.6), and highly significant associations (15.6) as estimated using Map Manager QTXb19.

