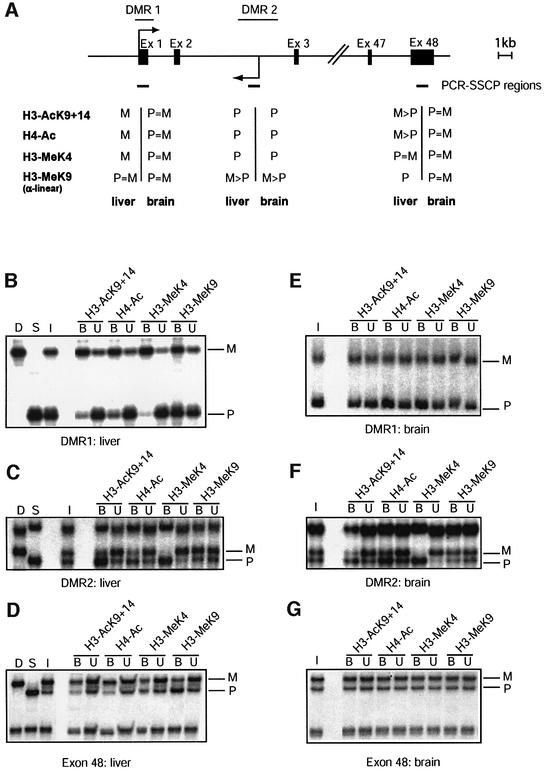
Fig. 3. Allele-specific histone methylation at the Igf2r gene. (A) Schematic presentation of the Igf2r gene, showing the DMR1 (paternal DNA methyl ation), DMR2 (maternal DNA methylation), the transcription initiation sites for sense and antisense transcription (arrows), and the position of exons (filled boxes). Regions analysed by ChIP are indicated underneath (small horizontal bars). (B) The DMR1 in liver. Presentation of results is as in Figure 1. (C) The DMR2 in liver. The same samples were analysed by PCR amplification with the primers from the DMR2. (D) 3′-end of the gene. The same samples as in Figure 2B were analysed by PCR amplification with primers at exon 48. (E) The DMR1 in brain. Chromatin extracted from brain was immunoprecipitated and analysed with the primers from the DMR1. (F) The DMR2 in brain. The precipitated samples as in Figure 2C were analysed with the primers at the DMR2. (G) 3′-end of the gene. The same samples as in Figure 2B were analysed by PCR amplification with primers at exon 48.

An official website of the United States government
Here's how you know
Official websites use .gov
A
.gov website belongs to an official
government organization in the United States.
Secure .gov websites use HTTPS
A lock (
) or https:// means you've safely
connected to the .gov website. Share sensitive
information only on official, secure websites.
