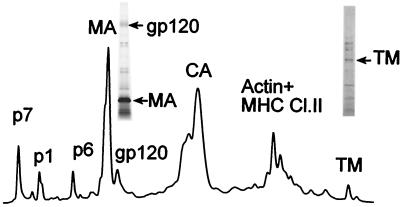
FIG. 4.
HPLC analysis of HIV-1 MN/H9 cl.4. After purification, virions were disrupted in 8 M guanidine-HCl and separated by HPLC. Peaks were detected at 280 nm. Proteins eluted from the column with an acetonitrile gradient were analyzed by SDS-PAGE, immunoblot, mass spectrometry, protein sequencing, and amino acid analysis. After gp120 and gp41 were identified on the HPLC profile by immunoblot, fractions containing SU and TM were analyzed by SDS-PAGE followed with silver staining (insertions on HPLC picture).

