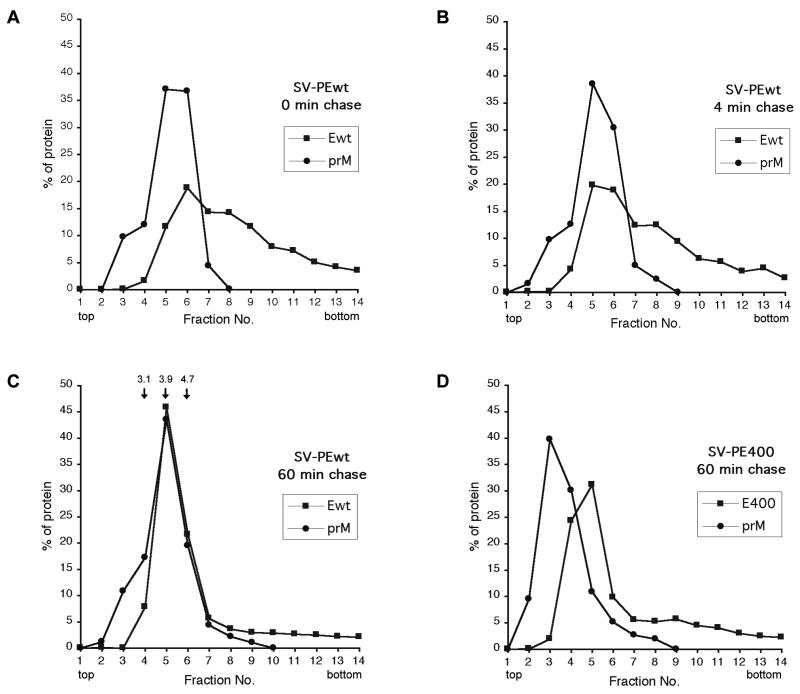
FIG. 8.
Cosedimentation analysis of prM and E at various chase times. Cells transfected with recombinant plasmids encoding prM and Ewt (A to C) or prM and stem- and membrane anchor-free E400 (D) were pulsed for 2 min and chased for the indicated times. The postnuclear supernatants were subjected to velocity sedimentation on 5 to 20% (wt/wt) sucrose gradients. Subsequently, the proteins were immunoprecipitated from the gradient fractions with a polyclonal antiserum recognizing both prM and E, analyzed by reducing SDS-PAGE, and visualized by fluorography. The relative amount of prM and E protein from each fraction (out of a total of 100% over all 14 fractions) was quantitated. The arrows above fractions 4 to 6 in panel C indicate the S20 sedimentation coefficient standards, as determined by quantification of a velocity sedimentation gradient run with a protein molecular weight marker.

