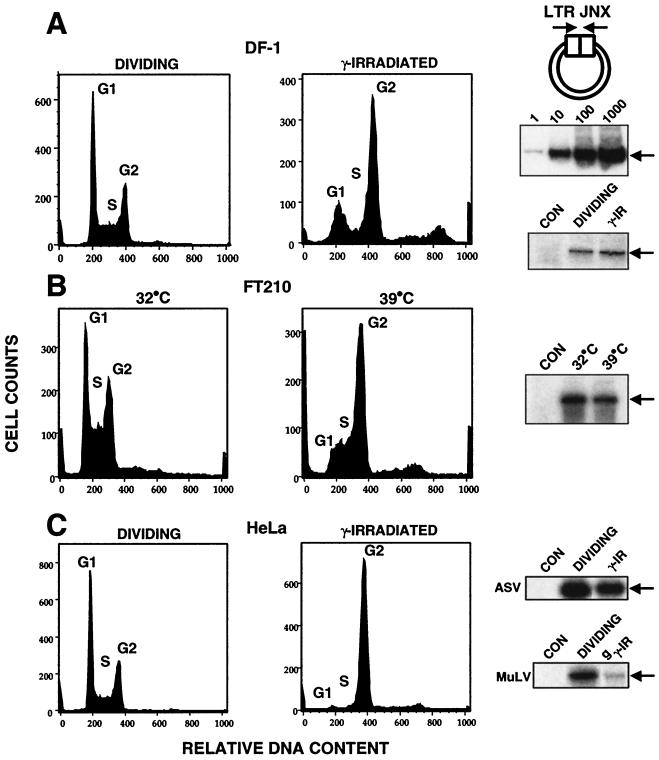
FIG. 1.
Nuclear import of retroviral DNA in arrested cells. Viral DNA LTR junctions signify nuclear entry of viral DNA. In each panel, the cell cycle profiles are shown along with gel analyses of the PCR product corresponding to LTR junctions (LTR JNX [arrows]). FACS analyses for DNA content indicate cell cycle status. Cell cycle profiles shown on the left represent dividing cells, and those on the right are for arrested cells. Dividing and arrested cells were exposed to the ASV amphotropic virus for 2 h, and DNA was isolated 16 to 24 h postinfection for PCR analyses. PCR analysis of mock-infected cells (CON) is shown. Cell cycle profiles were obtained from separate experiments using identical conditions. (A) DF-1 chicken embryo fibroblast line. At top right, a diagram of the PCR strategy is shown; the middle panel presents a standard curve for PCR showing a linear response over 3 to 4 logs. (B) FT210 cell line. (C) HeLa cell line. See Materials and Methods for details.

