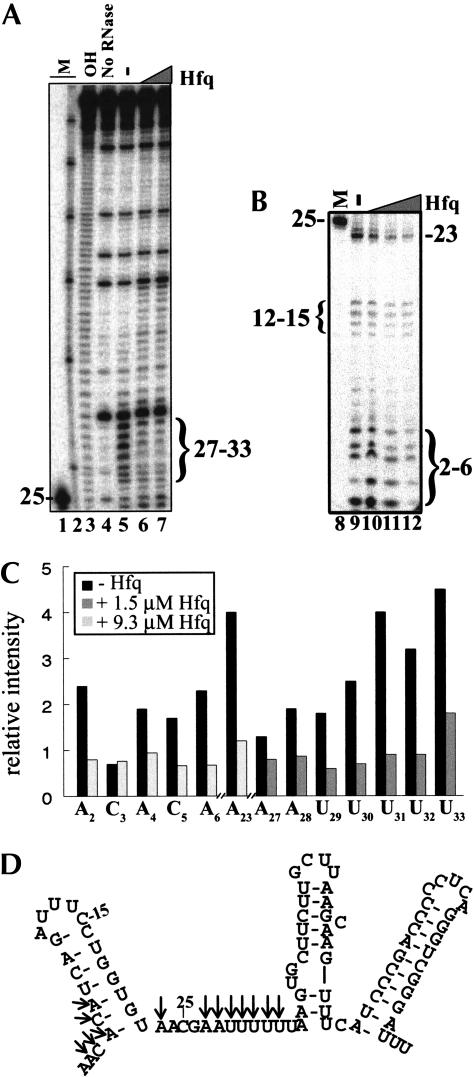
FIGURE 6.
RNase I cleavage of the DsrA–Hfq complex. DsrA in the absence and presence of varying concentrations of Hfq protein was cleaved by RNase I. Samples were analyzed on a denaturing polyacrylamide gel. (A) RNase I cleavage of the DsrA–Hfq complex showing nucleotides 25–85. End-labeled DsrA (16 nM) was mixed with 0 (lane 5), 1.5 μM (lane 6), or 3.1 μM (lane 7) purified Hfq hexamer and incubated at 25°C for 10 min. This was followed by cleavage with 0.05 U of RNase I at 25°C for 2 min. (B) RNase I cleavage of the DsrA–Hfq complex showing nucleotides 2–26. End-labeled DsrA (16 nM) was mixed with 0 (lane 9), 1.5 μM (lane 10), 3.1 μM (lane 11), or 9.3 μM (lane 12) purified Hfq hexamer and treated as above. Markers (M) are 5′-end-labeled DsrADI (lanes 1,8); Decade Marker (Ambion) representing 30, 40, 50, 60, 70, 80, and 90 nt (lane 2); and limited hydrolysis of DsrA (OH, lane 3). (C) Quantitative analysis of protected nucleotides shown in A and B in the absence (lanes 5,9, black bar) or presence (lane 6, dark gray bar) of 1.5 μM Hfq or 9.3 μM Hfq (lane 12, light gray bar). Individual bands were quantitated using a phosphorimager and normalized to the amount of full-length DsrA in the same lane. The data shown are representative of several independent experiments. (D) Structure of DsrA proposed by Lease and Belfort (2000), with arrows showing the nucleotides that are cleaved less by RNase I in the presence of Hfq.

