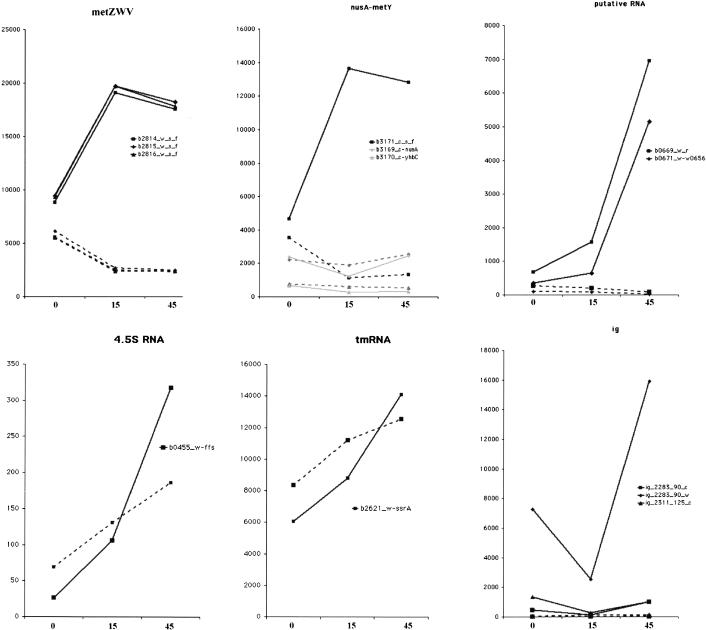
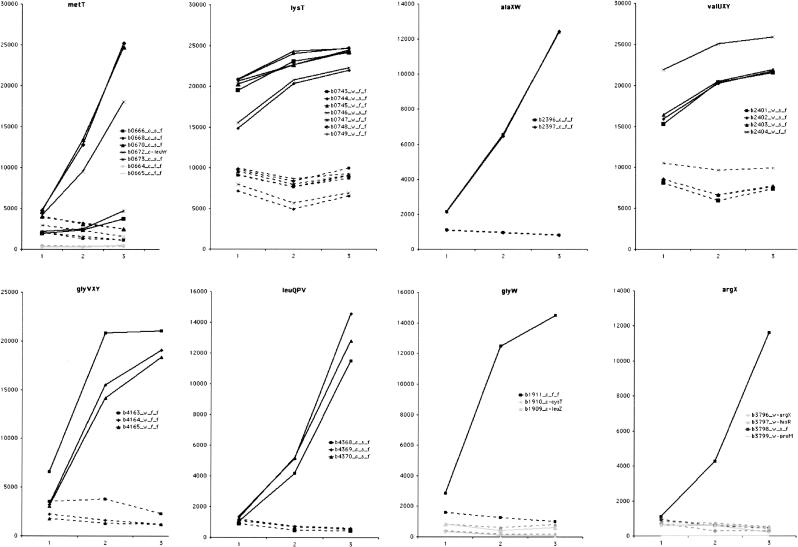
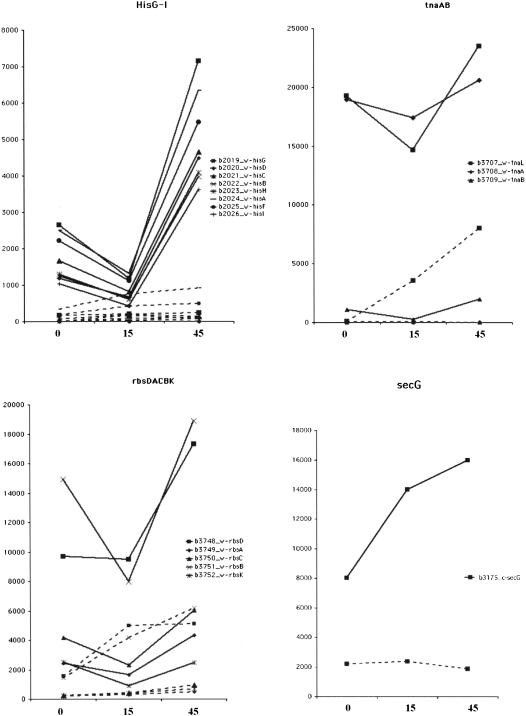
FIGURE 6.
Graphic representation of gene expression in various gene clusters. Different genes are labeled by different symbols: solid line, A49; dashed line, WT. The symbols in each panel represent the species followed. Two known RNase P substrates (4.5S RNA and tmRNA) are also shown here, although they are not part of these clusters.


