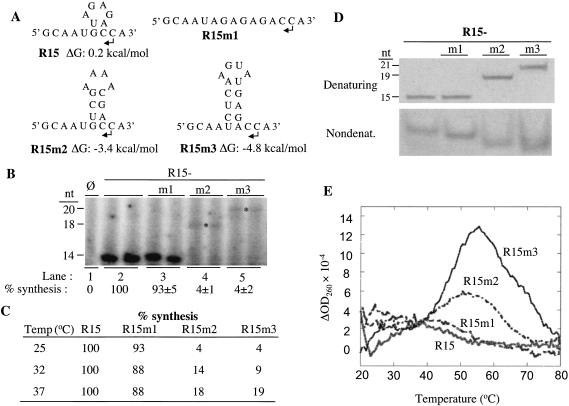
FIGURE 2.
Effects of R15 and its derivatives on RNA synthesis. (A) Sequence and predicted structures of R15 and its derivatives. Bent arrows denote the initiation cytidylates. Names and ΔG are shown below the sequences. (B) Effects of the structures on RNA synthesis by BMV replicase at 25°C. Qualitative results for all reactions are run in duplicate. “φ” denotes a reaction performed in the absence of exogenously provided RNA. Quantifications of at least three independent reactions for each RNA are shown below the autoradiogram. All quantifications were normalized for the number of radiolabled cytidylates incorporated relative to the control and are from two independent assays. The size of the replicase products, in nucleotides, is shown to the left of the autoradiogram. Asterisks are used to aid the identification of the faint bands from R15m1 and R15m2. (C) Quantified results of RNA synthesis assay performed at 25, 32, and 37°C. (D) RNAs visualized after electrophoresis of 40 pmole of RNAs in a 7 M urea PAGE (upper image) and 120 pmole of RNA in a nondenaturing PAGE (lower image). In our hands, RNAs in nondenaturing gels tend to appear as fuzzier bands, likely due to the RNAs retaining a greater degree of conformational flexibility in the absence of urea. (E) RNA thermodenaturation analysis. A first derivative of the absorbance at 260 nm is plotted as a function of temperature. The Tm of R15 and R15m1 are estimated to be 18°C, while the Tms of R15 m2 and R15m3, are 52 and 56°C, respectively.

