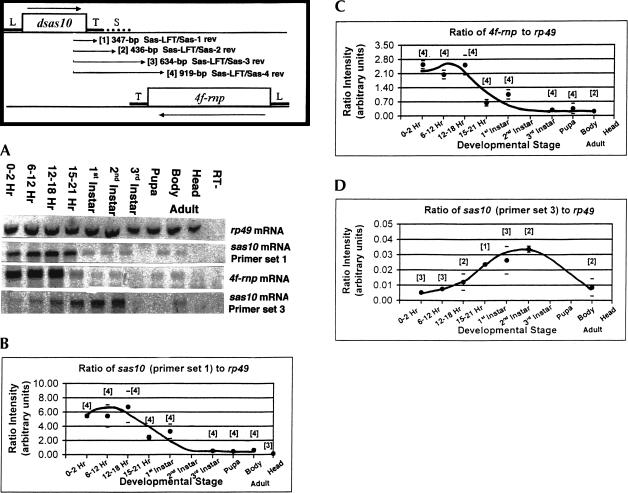
FIGURE 2.
Quantitative RT-PCR of 4f-rnp and sas-10 transcript levels during development. Orientation diagram shows locations of genes and polarities of their corresponding transcripts. Locations of nested primer sets numbered 1–4 used for PCR are at each end of the arrows. Gene leader (L), trailer (T), and intergenic spacer (S) locations are shown. (A) Representative gels after SYBR Green I staining of cDNA bands. (B) Shorter length sas-10 transcript levels during development, relative to rp49 reference. Numbers of repeat determinations per developmental stage are shown in brackets and standard error bars are indicated. (C) 4f-rnp transcript levels during development, relative to rp49 reference. Labeling is as in (B). (D) Long sas-10 readthrough transcript levels during development, relative to rp49 reference. Labeling is as in (B). Note the roughly 200-fold difference in sas-10 signal intensities between (B) and (D) and also that levels of 4f-rnp and sas-10 readthrough transcripts (C) and (D) are inversely related at late embryo stages of development (15–21 h).

