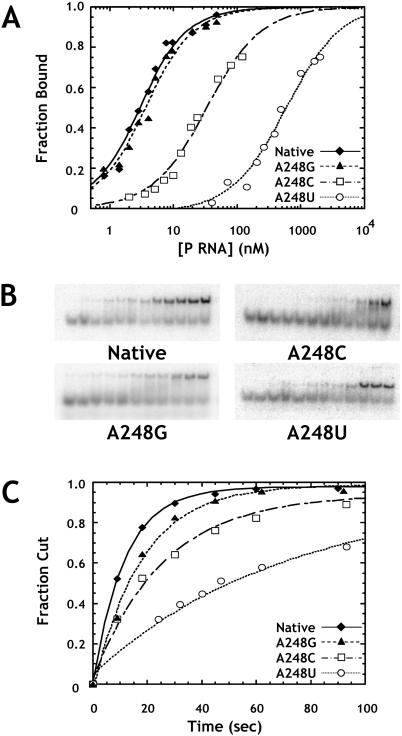
FIGURE 2.
Effects of A248 mutants on binding and catalysis by the RNase P ribozyme. (A) Binding of pre-tRNA by A248 mutant ribozymes as assayed by gel mobility shift. Normalized plots show the fraction of substrate shifted to the bound complex as a function of enzyme concentration. Reactions contained 1 M ammonium acetate, 25 mM CaCl2, 20 mM PIPES at pH 6.0, and 2 nM ligated substrate. The data are fit to Equation 1 (see Materials and Methods). (Diamonds) Data for the native ribozyme; (triangles) A248G; (squares) A248C; and (circles) A248U. (B) Primary data from which the curves in A were obtained. Enzyme concentrations increase from left to right. (C) Normalized plots of fraction cut versus time for single turnover reactions at saturating enzyme concentrations (see Materials and Methods). Reactions were carried out under standard conditions (see Materials and Methods) with 4 nM substrate. Data are fit to a single exponential function, and are labeled as in A.

