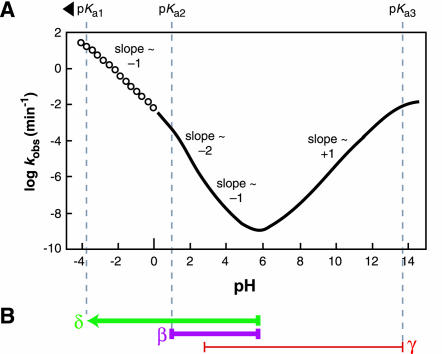
FIGURE 2.
Dependence of RNA transesterification on specific acid and specific base catalysis. (A) Plot of the logarithm of the rate constant (predicted, see Materials and Methods) for cleavage versus pH at room temperature. Solid line indicates the region of the curve for which measured data exists for comparison value (Järvinen et al. 1991; Li and Breaker 1999). Open points indicate the region of the curve that is extrapolated based on the assumption that the pKa of the bridging 5′ oxygen is less than zero (~−3.5) and that no other rate-determining protonations occur below pH 0. The overall shape and slope of the curve match the previously reported data collected at 90°C (Järvinen et al. 1991). (B) Interpretation of the slope transitions of the curve depicted in A. The pH range over which the rate constant is dependent on protonations (β and δ) are shown with thick purple and green lines, respectively. The pH range in which the rate constant is affected by a deprotonation (γ) is shown with a thin red line. Measurements at 90°C show that the region between approximately pH 3 and 5 appears to have a slope of −1, which we interpret as reflecting two rate-determining protonations and one rate-determining deprotonation (see text).

