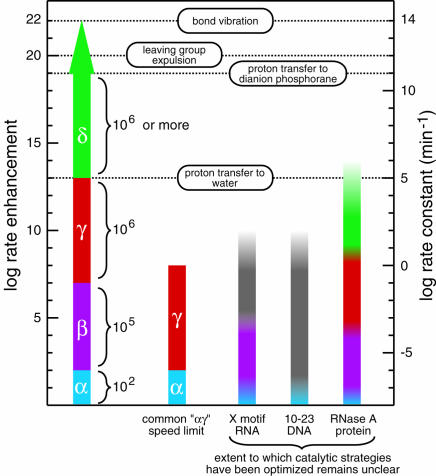
FIGURE 3.
Magnitudes of rate enhancement for the four catalytic strategies. The individual and cumulative rate enhancements derived from enzymes perfecting each catalytic strategy are shown (left scale) from a baseline rate constant value of 10−8 min−1 (right scale) for the rate constant of RNA cleavage at neutral pH and 23°C without divalent metals (Li and Breaker 1999). The rate enhancement for perfect utilization of a combined αγ strategy, a commonly encountered speed limit of engineered ribozymes and deoxyribozymes (Breaker et al. 2003), is depicted next to the putative catalytic strategies used by several nucleic acid and protein enzymes. Open-top columns denote the fact that the highest rate constants measured for these enzymes do not reflect the rate constant of the chemical step. The X-motif RNA and 10–23 DNA columns are colored to reflect possible explanations for their rate enhancement, but structures and catalytic mechanism have not been definitively solved for either enzyme. The graded coloring is used to note the fact that it is not evident that the enzymes use the various catalytic strategies to their fullest extent. First-order rate constants of bond vibration and proton transfer from imidazolium ion to water were taken from Fersht (1999). Those of proton transfer to, and leaving group expulsion from, the dianion phosphorane intervening species of phosphoester transfer were taken from Perreault and Anslyn (1997).

