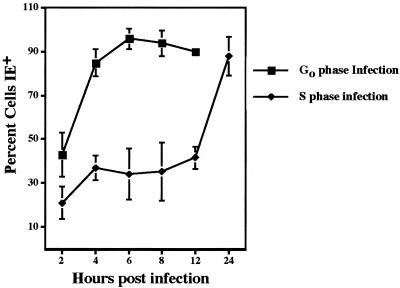
FIG. 1.
Disparity between timing of IE gene expression during infection in G0 versus S phase. Cells were confluence synchronized, trypsinized, and reseeded onto coverslips for infection immediately (G0) or 24 h later (S). At the indicated times, coverslips were harvested and stained for IE protein expression with CH16.0 Ab. Points represent the averages of at least two trials, with error bars indicating 1 standard deviation.

