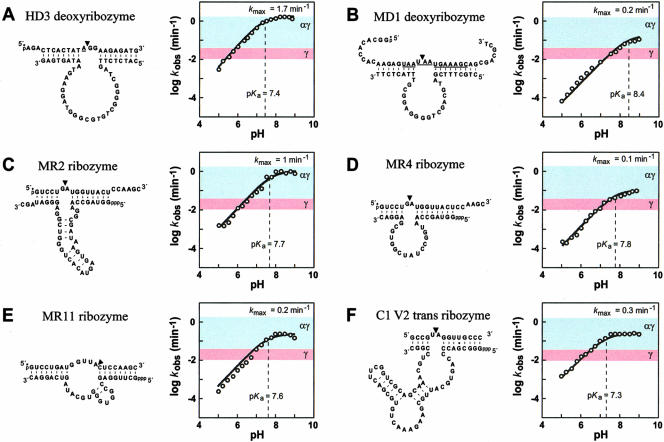
FIGURE 3.
The influence of pH on the kobs for six RNA-cleaving ribozymes and deoxyribozymes. In each panel, the sequence and secondary structure model for bimolecular constructs of the ribozyme or deoxyribozyme (bottom strand) and substrate (top strand) is depicted. An arrowhead designates the site of cleavage. The substrates for HD3 and MD1 are DNA oligonucleotides that carry RNA linkages (underlined). The plot in each panel shows the logarithm of the kobs for enzyme catalysis as a function of pH. The dashed line identifies the pH required to attain half-maximal kobs. Colored zones indicate the range of rate constants that are expected from enzymes that fully use the γ catalytic strategy (pink) or a combination of α and γ catalytic strategies (light blue) to the exclusion of other possible strategies. The deoxyribozyme HD3 was analyzed with HME as a cofactor; the remaining enzymes used MgCl2. Reagent concentrations were as follows (enzyme, KCl, and cofactor, respectively): (A) HD3: 100 nM, 1 M, 400 mM; (B) MD1: 1 μM, 200 mM, 10 mM; (C) MR2: 300 nM, 150 mM, 350 mM; (D) MR4: 35 nM, 250 mM, 35 mM; (E) MR11: 100 nM, 500 mM, 750 mM; (F) C1 V2 Trans: 300 nM, 250 mM, 1 M. Below pH 7, assays of MD1 were buffered with succinate, and MR2 and MR4 with Bis-Tris.

