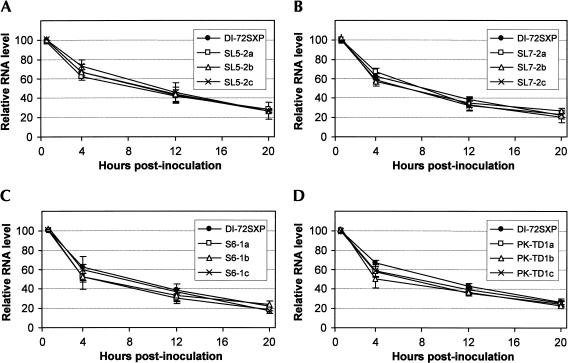
FIGURE 14.
In vivo stability analysis of DI RNAs for mutants with compensatory mutations in (A) SL5, (B) SL7, (C) S6, and (D) PK-TD1. Protoplasts that were inoculated with DI RNAs only and total nucleic acids were extracted at 1, 4, 12, and 20 h postinoculation. DI RNA levels were determined by Northern blot analysis and quantified by radioanalytical scanning of membranes. The graphs represent relative DI RNA levels as a function of time. The values represent means from two separate experiments.

