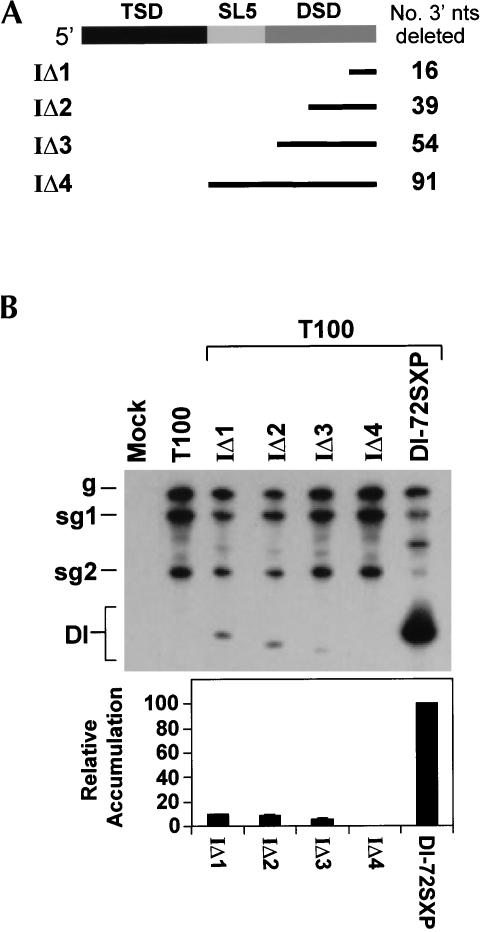
FIGURE 7.
Deletion analysis of the 3′ portion of the 5′ UTR. (A) Mutant names are given on the left. The corresponding segments deleted are represented by the black lines, and the number of nucleotides deleted in each mutant is listed to the right. (B) Northern blot analysis and quantification of DI RNA accumulation levels.

