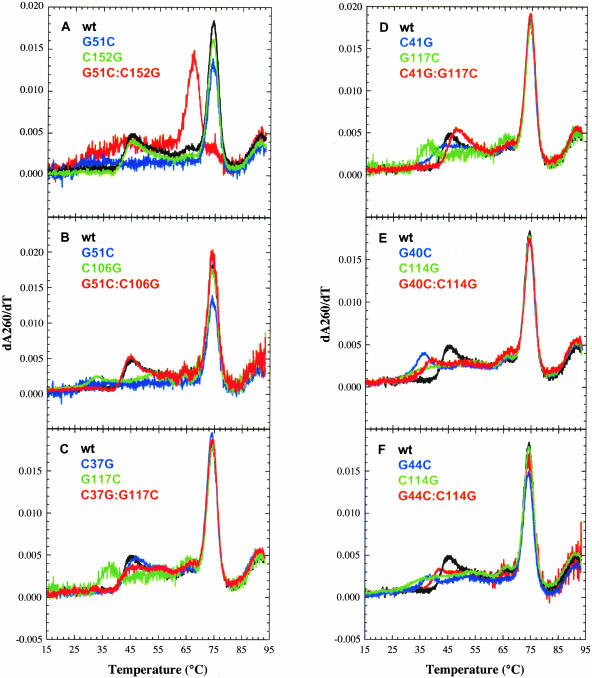
FIGURE 9.
Thermal denaturation curves for wild-type and mutant B. stearothermophilus trp leader RNAs. All RNAs (36–191) were melted from 5°C–95°C at pH 6.5 with a step of 0.1°C, and the data were smoothed over 3°C before taking the first derivative. Data from 15°C–95°C are provided. (A) Plots for wild-type (black), G51C (blue), C152G (green), and G51C:C152G (red). (B) Wild-type (black), G51C (blue), C106G (green), and G51C:C106G (red). (C) Wild-type (black), C37G (blue), G117C (green), and C37G:G117C (red). (D) Wild-type (black), C41G (blue), G117C (green), and C41G:G117C (red). (E) Wild-type (black), G40C (blue), C114G (green), and G40C:C114G (red). (F) Wild-type (black), G44C (blue), C114G (green), and G44C:C114G (red).

