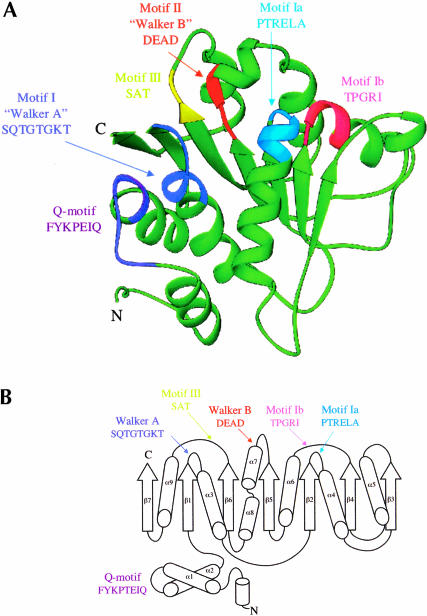
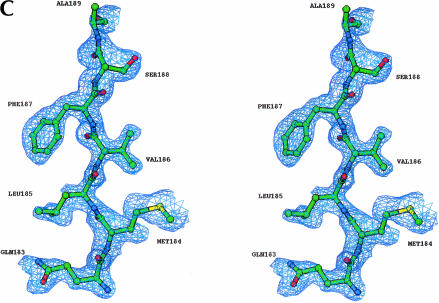
FIGURE 1.
Structure of the BstDEAD N-terminal domain. (A) Ribbon representation of BstDEAD-NT consisting of residues 4–211. The color coding used to distinguish the conserved motifs follows the method of Tanner and Linder (2001) and is maintained through the other figures as follows: Q-motif, purple; motif I (Walker A), blue; motif Ia, light blue; motif Ib, pink; motif II (Walker B or DEAD), red; and motif III (SAT), yellow. The motifs found in the N-terminal domain include all that is necessary for ATP recognition and hydrolysis. This figure, as well as Figures 1C ▶, 3 ▶, 5 ▶, and 6A–C ▶, was made with RIBBONS (Carson 1997). (B) Topological organization of the BstDEAD N-terminal domain. β-Strands are depicted as arrows; α-helices, as cylinders. The elements that are not included in the RecA-like core are α1, α2, α5, β3, and β7. Locations of the conserved motifs are shown and colored as in A. (C) Stereo diagram showing representative experimentally phased electron density using MAD data from BstDEAD-NT calculated to 1.85Å and contoured at 1 σ. The amino acids are from the refined BstDEAD-NT model and include part of the SAT motif (motif III).


