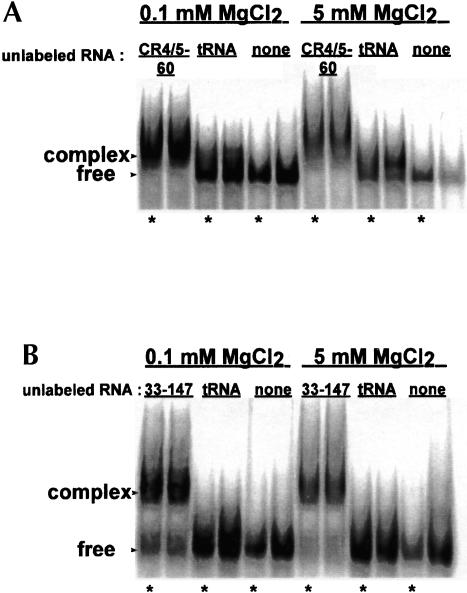
FIGURE 2.
Native gel mobility shift assays reveal complex formation between CR4/5–60 and RNA33–147. (A) 32P 5′-end labeled RNA33–147 in the presence of excess unlabeled RNA. (B) 32P 5′-end labeled CR4/5–60 in the presence of excess unlabeled RNA. For both A and B, the indicated MgCl2 concentrations correspond to MgCl2 binding buffer concentrations (see Materials and Methods). Because minimal differences are observed between the two binding buffers, all following gels show samples assayed in 5 mM MgCl2. Bands with reduced mobility in each gel correspond to an RNA–RNA complex whereas the faster migrating bands correspond to free RNA. Samples in lanes marked by an asterisk (in this and all following mobility shift gels) were incubated for 30 min at 37°C prior to loading on 6% native gels.

