FIGURE 4.
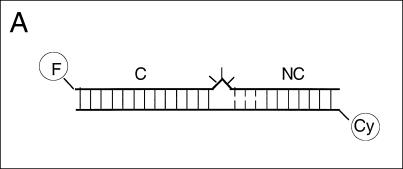
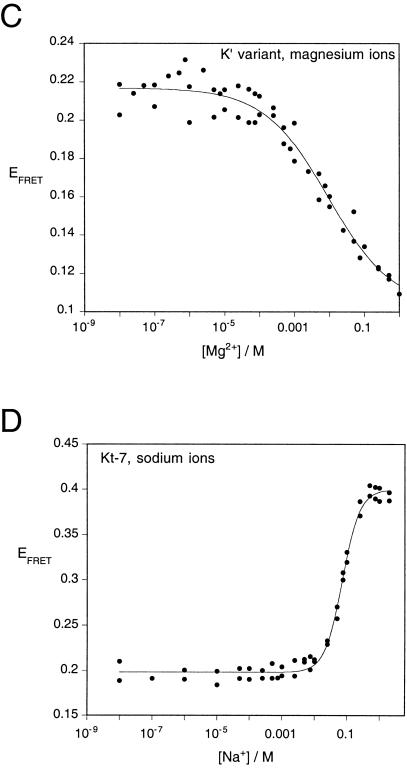
An ion-induced conformational transition in the K-turn structure followed by FRET. (A) The change in structure was followed as a change in FRET efficiency between fluorescein (F) and cyanine 3 (Cy) fluorophores attached to the 5′-termini of an RNA duplex containing a Kt-7 motif. The C arm was 13 bp and the NC arm 7 bp (not including the three G•A mismatches). An equivalent species in which the three mismatches were converted to Watson-Crick base pairs was also studied. FRET efficiency measured in the steady-state for these species as a function of ionic concentration, and in each case the change in EFRET was fitted using a two-state model of the transition (line). (B) EFRET measured for the Kt-7 structure as a function of magnesium ion concentration. (C) EFRET measured for the converted K′ structure as a function of magnesium ion concentration. In contrast to the K-turn, this species undergoes a decrease in EFRET with increased magnesium ion concentration. (D) EFRET measured for the Kt-7 structure as a function of sodium ion concentration.


