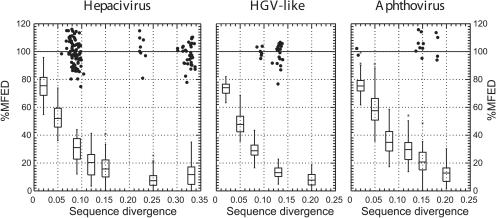
FIGURE 6.
Effect of simulated neutral sequence drift on MFEDs of viruses with predicted RNA structure. Coding regions of complete genome sequences of HCV genotype 1b (GenBank accession number HPCJ491), HGV/GBV-B (genotype 2; HGU94695), and FMDV (PIFMDV2) were each mutated independently 10 times to produce sequences showing a range of sequence divergence from the original (X-axis). MFEDs, using the NDR algorithm to generate 50 sequence order randomized sequences, were calculated for each and expressed as a percentage of the MFED of the starting sequence (Y-axis). The distributions of MFED values for the mutated sequences are represented as box and whisker plots (showing 95% percentile [line], standard deviation [upper and lower box], and mean values [line within box], with outliers indicated by the symbol *). For comparison, MFEDs for naturally occurring variants in each virus group expressed as a percentage of the MFED of the starting sequences were plotted using the symbol •.

