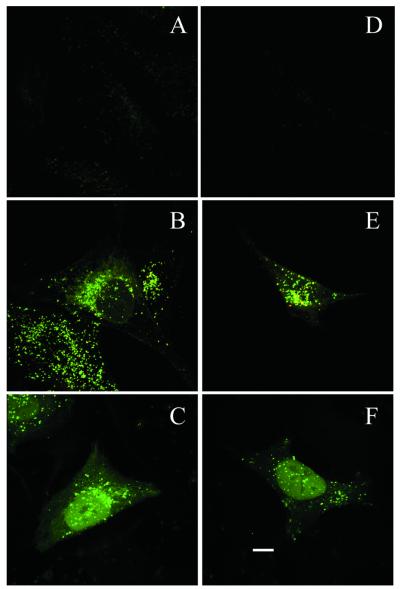
Figure 1.
Confocal microscope projection image of cellular distribution of antisense ODN in 518A2 (A–C) and HEK 293 cells (D–F). Cells were exposed to free antisense ODN (A and D), PFV-encapsulated antisense ODN (B and E) or cationic liposome–antisense ODN complexes (C and F) for 4 h. Scale bar 10 µm.

