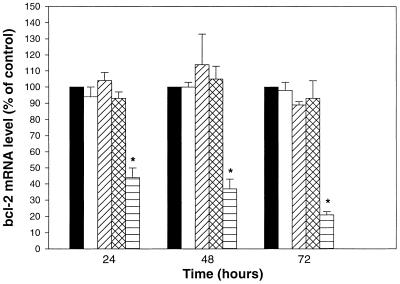
Figure 6.
Expression of bcl-2 mRNA in 518A2 cells upon exposure to HBS (shaded bar), free antisense (open), empty PFV (diagonal hatched), PFV–control ODN (G3622) (cross-hatched) or PFV–antisense ODN (G3139) (horizontal) at a final antisense concentration of 3.0 µM. The abundance of bcl-2 mRNA was evaluated by RT–PCR. Values were presented as means ± SEM (n = 3). *, Significant difference between PFV–antisense ODN group and the rest of the treatment groups (P < 0.05).

