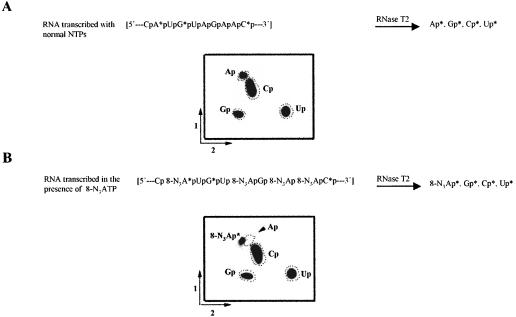
FIGURE 5.
Nearest-neighbor and nucleotide analysis of [α-32P] UTP-labeled RNA. (A) Upper: Schematic representation of RNase T2 digestion. RNA transcribed in the presence of ATP was isolated and digested to completion with RNase T2 (see Materials and Methods for details), and the resulting nucleoside 3′ monophosphates were separated by 2-dimension TLC. The positions of the unlabeled nucleoside 3′ monophosphates were visualized via UV shadowing before autoradiography, and are indicated as dotted circles. (B) As described in A except that 8-N3AMP-containing RNA was used.

