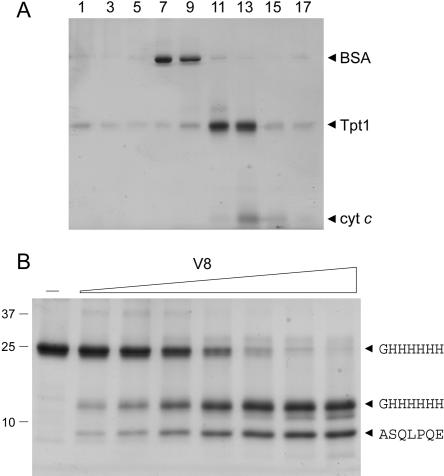
FIGURE 2.
Sedimentation and limited proteolysis of Tpt1. (A) Glycerol gradient sedimentation. An aliquot (80 μg) of the Ni-agarose preparation of His10-Tpt1 was mixed with BSA (40 μg) and cytochrome c (50 μg). The protein mixture was applied to a 4.8-mL 15%–30% glycerol gradient containing 50 mM Tris-HCl (pH 8.0), 300 mM NaCl, 1 mM EDTA, 2 mM DTT, 0.025% Triton X-100. The gradient was centrifuged in a Beckman SW50 rotor at 50,000 rpm for 16 h at 4°C. Fractions (~0.26 mL) were collected from the bottom of the tubes. Aliquots (12 μL) of odd-numbered fractions were analyzed by SDS-PAGE. (B) Proteolysis. Reaction mixtures (20 μL) containing 10 mM Tris-HCl (pH 8.0), 5 μg of Tpt1, and 1.6, 3.1, 6.2, 12.5, 25, 50, or 100 ng of V8 protease (from left to right) were incubated for 15 min at 22°C. V8 protease was omitted from the control mixture shown in lane –. The reactions were quenched by adding SDS and the digests were resolved by SDS-PAGE. The Coomassie Blue-stained gel is shown. The positions and sizes (kDa) of marker polypeptides are indicated on the left. Duplicate samples were resolved by SDS-PAGE and the gel contents were transferred electrophoretically to a polyvi-nylidene difluoride membrane. Polypeptides were visualized by staining the membrane with Coomassie Blue dye. Membrane slices containing intact His10-Tpt1 and individual proteolytic products (denoted by arrow-heads on the right) were excised and subjected to automated Edman sequencing. The sequences are indicated in single-letter code (right).

